Characteristics of vegetation carbon sink carrying capacity and restoration potential of China in recent 40 years
 Luhua Wu
 Yun Zhang1
 - 1School of Economics and Management, Tongren University, Tongren, China
- 2Tongren Rural Revitalization Research Institute, Tongren, China
- 3Engineering Center of Intelligent Monitoring and Policy Simulation of Mountainous Territory Space, Tongren, China
- 4Guizhou Provincial Key Laboratory of Geographic State Monitoring, Guizhou Education University, Guiyang, China
Improving vegetation carbon sink is a key measure for China to achieve the goal of carbon neutrality. However, the gradual saturation of vegetation carbon fixation under the constraints of climate change and human activities has limited the long-term and sustainable growth of vegetation carbon sinks, resulting in significant uncertainty in understanding future carbon sink capacity and recovery potential. In this study, NPP has been selected as a carbon sink indicator to quantitatively evaluated the carbon sink carrying capacity (CSCC) and the carbon sink resilience (CSR) of China. Results demonstrated that (1) the NPP of vegetation cover areas in China exhibited an increasing trend from 1981 to 2018, with an average growth rate of 1.66 g C m−2 yr.−1 and a total net NPP increase of 0.32 P g C. (2) The average CSCC in China was 658.59 g C m−2 yr.−1, with a total amount of 4.13 Pg C yr.−1. The NPP exceeded 60% of CSCC in various years, and the total NPP in 2018 was 3.26 Pg C yr.−1, which reached 78.74% of CSCC. In the future, carbon sink that can be increased is 0.88 Pg C yr.−1, with an increase proportion of 21.26%. (3) From 2000 to 2018, the NPP of vegetation-covered area (VCA) in China had generally maintained a positive succession trend with the stronger CSR. Only four provinces (HUN, CQ, AH, and JS) in China showed the extremely strong levels of CSR. The study has revealed the huge and sustainable CSCC and restoration potential in China over the past 40 years, and has provided spatial positioning and theoretical guidance for future ecological carbon sink restoration and benefit assessment.
1. Introduction
Vegetation carbon sink is an important part of terrestrial vegetation carbon sink. Due to its huge carbon sequestration and carbon sink potential (Zhao and Running, 2010; Hasenauer et al., 2012; Erbaugh et al., 2020), it has been recognized by IPCC (United Nations Intergovernmental Panel on Climate Change) as one of the effective ways to achieve the carbon neutrality goal (Leitzell, 2013; Cook-Patton et al., 2020). However, the changes in vegetation carbon sinks exhibit significant volatility due to climate change and human activities, which poses certain limitations for accurately understanding carbon sink carrying capacity (CSCC) and potential for future increasing (Benítez et al., 2007; Pan et al., 2011; Gahlot et al., 2017; Ben et al., 2018; Fang et al., 2018; Fernández-Martínez et al., 2023). Therefore, it is of great scientific significance to accurately assess the dynamic evolution process of CSCC and its growth potential for in-depth understanding of the terrestrial carbon cycle, accelerating ecological restoration and construction, and promoting the realization of carbon neutrality.
In recent 40 years, China has become a hot area for enhancing and contributing to global vegetation carbon sinks due to large-scale artificial afforestation and natural restoration. However, vegetation carbon sinks have increased rapidly under the influence of climate change and human activities. The gradually saturated vegetation carbon fixation begins to limit the long-term and sustainable growth of vegetation carbon sinks (Doelman et al., 2020; Domke et al., 2020). Even the southern region of China, which has the highest afforestation intensity, potential, and area, has encountered problems such as low afforestation efficiency and difficulty in sustaining large-scale afforestation (Tong et al., 2018, 2020; Cai et al., 2021; Zhang et al., 2021, 2022a). In recent years, many researchers have conducted numerous studies on the effectiveness and potential improvement of carbon sequestration in China’s ecosystem, and achieved significant theoretical results. Wang J. et al. (2020) has estimated the terrestrial system carbon sink of China to be 0.62–0.81 Pg C based on satellite and ground observation data, respectively. Considering the impact of lateral transport, the carbon sink of terrestrial ecosystems in China is approximately 0.47–0.66 Pg C (Wang J. et al., 2020). In addition, the potential NPP potential of China have also estimated based on the LPJ-GUESS (Tang et al., 2010), Miami model (Wan et al., 2022), carbon footprint pressure index (Chen et al., 2020), Thornthwaite Memorial model (Tu et al., 2023), Multi-factor random forest model (Zhang et al., 2022b), and the improved CASA model (Liu et al., 2014; Zhang et al., 2014; Ren et al., 2017; Pan and Xu, 2020; Wang J. et al., 2020; Bi and Pan, 2022). These studies have comprehensively evaluated the current status of vegetation carbon sequestration capacity based on current statistical survey data or mature theoretical models, and conduct in-depth research on the resolution of chemical transport models and the representativeness of site observation data. Due to significant uncertainty in the model parameters and the biological, physical, and chemical interaction mechanisms in the model, there are significant differences in the estimated NPP potential. Although there are certain biases in different estimation models, the results all indicate that the terrestrial ecosystem of China has a huge carbon sink and still has great potential (He et al., 2017). However, most of the above studies focus on the assessment of current vegetation carbon sequestration capacity and identification of influencing factors, while researches on vegetation CSCC, increase proportion, and carbon sink resilience (CSR) characteristics is relatively weak, resulting in significant uncertainty in the quantitative assessment of the future potential of vegetation carbon sinks. Considering the high spatial heterogeneity of ecosystem CSR, there are obvious differences in the CSCC of each regional ecosystem. And due to the inability to accurately predict future climate conditions and vegetation growth characteristics, it is still difficult to accurately assess the CSCC of ecosystems, let alone efficiently identify the carbon sink potential that may exist in various regions in the future.
Here, this study aims to evaluate the CSCC of vegetation-covered area (VCA) in China (Figure 1), reveal the characteristics of CSR, and explore the potential for future increasing. We have attempted to select NPP as an indicator to represent vegetation carbon sink and use the maximum value synthesis method to evaluate the CSCC of China, diagnose annual vegetation carbon sink saturation, and quantitatively evaluate the potential for future increasing. Then, this study has further quantified the CSR intensity of ecosystems in various provinces of China based on the probability attenuation method. We have addressed the following scientific issues: (1) to investigate the change trend and spatial pattern of NPP during 1981–2018; (2) to assess the CSCC of China, diagnose the carbon sink saturation of vegetation in each year, and quantitatively evaluate the potential for future increasing; and (3) to quantify the CSR intensity of ecosystems in China and various provinces. The study has revealed the huge and sustainable CSCC and restoration potential of ecosystem in China, and has provided theoretical support for the optimization of the spatial layout of carbon sink potential improvement and the realization of the goal of carbon neutrality.
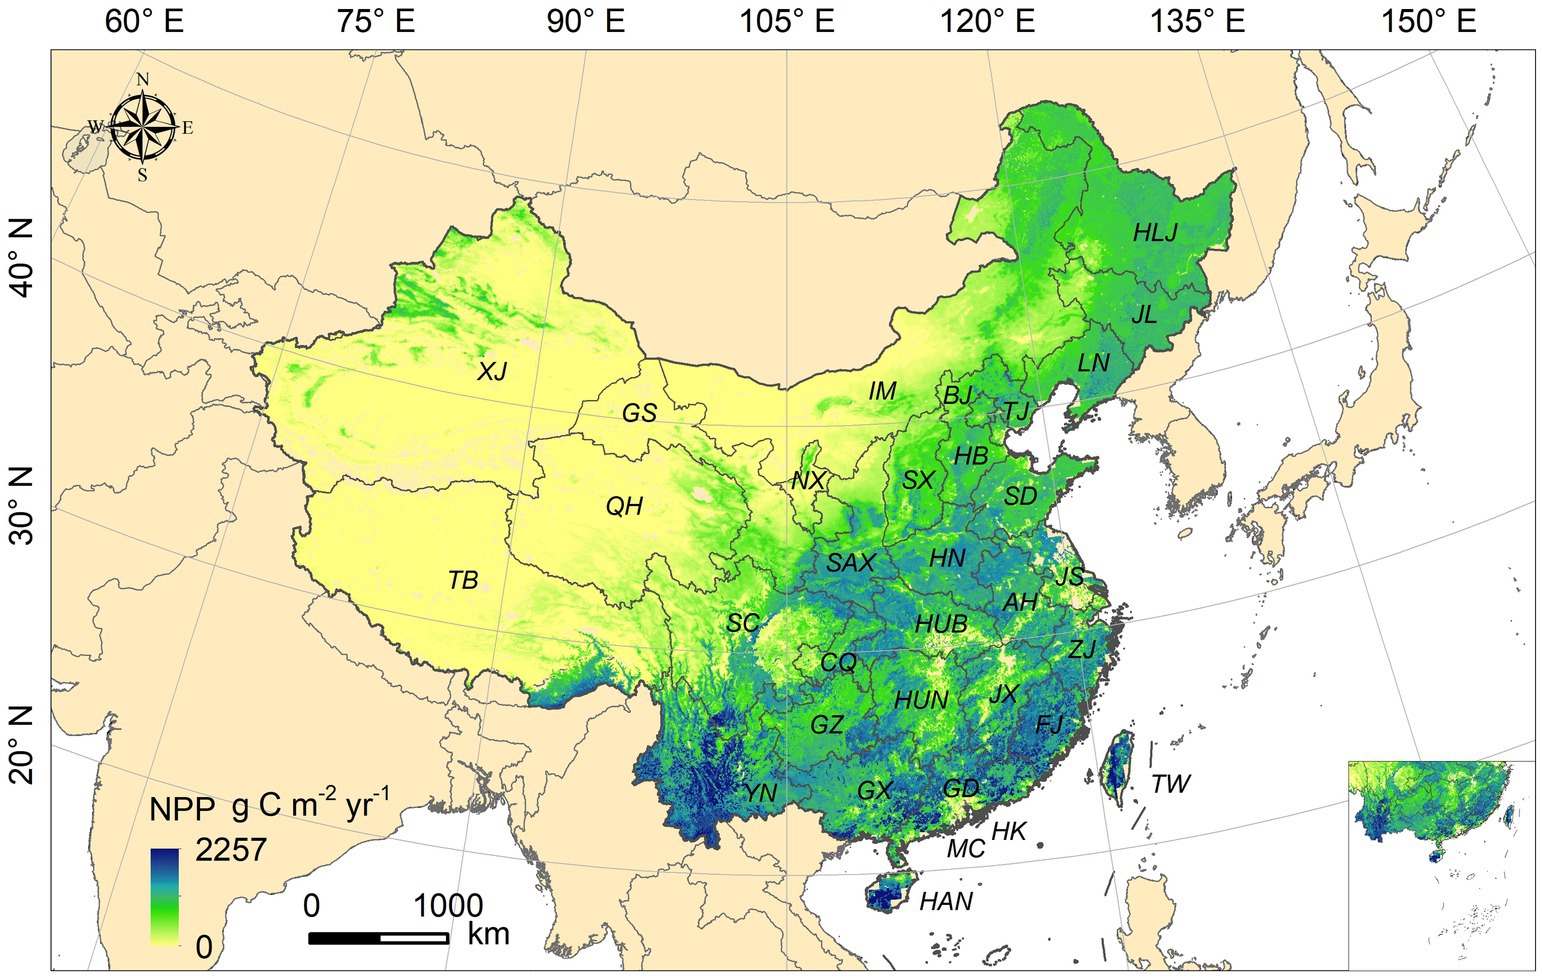
Figure 1. Spatial distribution of VCA and annual average NPP in China.
2. Data
The NPP data in this study is obtained from National Earth System Science Data Center, National Science & Technology Infrastructure of China.1 The GPP and NPP in this dataset are estimated using an improved vegetation productivity estimation model, MuSyQ-NPP (Multi source Data Synergized Quantitative Net Primary Productivity), which is based on light use efficiency. GPP is estimated based on remote sensing inversion of FPAR, LAI, and ERA-Interim meteorological data using a parameterized model of light energy utilization. The algorithm considers the impact of different ratios of direct and scattered radiation in solar radiation on light energy utilization efficiency, and improves LUE by introducing a clear sky index (CI). The actual LUE is estimated by combining temperature and remote sensing estimated evaporation ratio, and the photosynthetic effective radiation absorbed by vegetation is estimated from FPAR data, resulting in GPP products every 8 days. Remote sensing LAI products and temperature data are used to estimate vegetation maintenance respiration and growth respiration, respectively, to obtain daily scale autotrophic respiration (Cui et al., 2016; Yu et al., 2018; Wang M. J. et al., 2020). On this basis, the produced GPP products are used to deduct autotrophic respiration and obtain the average NPP every 8 days. The main calculation formula of the model is as follows.
Where LUE is the actual light use efficiency (g C/MJ), FPAR is the vegetation photosynthetic effective radiation absorption ratio, and PAR is the incident photosynthetic effective radiation (MJ/m2d). LUE is calculated using a parameterized method. Firstly, the maximum light energy utilization rate (LUEmax) under no stress is determined based on vegetation type and clear sky index CI, where (g C/MJ) represents the LUEmax of sun leaf and represents the LUEmax of shade leaf. The actual LUE is estimated through temperature and water stress, and the CI is used to reflect the influence of the scattered part of incident solar radiation on the LUE (g C/m2d). f(W) is the water stress. f(T) is the temperature regulating scalar. GPP represents the total primary productivity of vegetation (g C m−2 yr.−1), while NPP represents the net primary productivity of vegetation (g C m−2 yr.−1). Ra represents the autotrophic respiration of vegetation (g C m−2 yr.−1). The original data is sourced from GLASS LAI/FPAR products and ERA_Interim Meteorological Products. The NPP dataset has been preliminarily validated based on GPP data from FLUXNET sites, with high reliability and has been widely used.
The spatial resolution of NPP data was 5 km × 5 km, with a time resolution of 8 days, spanning from 1981 to 2018, containing 46 sets of global data annually. This study has calculated the average NPP of every 8 days in each month based on the number of days to obtain the monthly NPP, and accumulated it to obtain the annual NPP. The product can provide data support for global change and carbon cycle research, regional and global ecological environment monitoring and assessment.
3. Research methods
3.1. Calculation of CSCC and potential improvement
The maximum synthesis method is used to extract and synthesize the maximum NPP values for 38 years on each grid and the results obtained are considered to the CSCC that can achieve the maximum carbon sink under actual climate change and human activity conditions. Based on this, the difference between the CSCC and the annual NPP are regarded as the increase potential of NPP in each year. The specific calculation formula is as follows.
Where NPPMax represents the synthesis result of the maximum NPP value in the past 38 years to characterize the CSCC; NPP i is NPP value for each year. represents the increase proportion for vegetation carbon sequestration.
3.2. Trend analysis
The trends and significance characteristics of NPP changes are estimated by using the least square method. The calculation formula is as follows.
Where K is the slope of NPP change, t is the study year; n is the study period. i represents the year order; and NPP i is the independent variable corresponding to year j. If the correlation coefficient of the regression equation passes the significant confidence levels 0.05 and 0.01 (p < 0.05 and p < 0.01), the NPP will be reduced or increased to significant and extremely significant levels, respectively.
3.3. Probability attenuation method
An ecosystem can be seen as composed of several “grids,” and the NPP of each grid increases or decreases over time, with a positive or negative slope of the change trend. The longer the time, the lower the probability that the NPP change slope of the grid will always remain positive or negative trend. The decreasing trend can be fitted using an exponential decay function, and the difference in decay time between positive and negative trends can measure the ecosystem resilience. When the positive decay rate is less than the negative decay rate, the ecosystem resilience is better, and vice versa. The larger the difference, the higher the ecosystem resilience.
The evaluation of ecosystem resilience needs to include steps such as time division, calculation of NPP change slope, slope grid surface calculation, maintenance grid surface calculation, exponential attenuation fitting, and ecosystem resilience calculation.
3.3.1. Time division
Firstly, the NPP of a long time series is divided into two periods: the starting period and the fitting period. The fitting period requires sufficient sample data to fit the attenuation function. 1999 is the starting year for China to implement the policy of returning farmland to forests, and it was a landmark event in the process of ecosystem change in various provinces of China. Therefore, this study has defined 2000 as the reference year and taken the period from 1981 to 1999 as the starting period and the period from 2000 to 2018 as the fitting period. The calculation formula is as follows:
where T(t0, t) is the research period; T(t0, t' ) is the starting period; T(t', t) is the fitting period, t0 is the initial year, and t' is the reference year.
3.3.2. Grid slope calculation
The slope of NPP changes for each grid from the initial year (t0) to the reference year (t') and from the initial year (t0) to the evaluation year (ti) are calculated based on 5 km × 5 km grid of vegetation coverage in China.
3.3.3. Slope grid surface calculation
The slope of the grid surface for each year is calculated according to the NPP change slope of the grid, When the NPP change slope of the grid is positive, assign the value of the slope grid surface to 1; when the NPP change slope of the grid is negative, the value of the slope grid surface is assigned as −1.
where S(ti) is the slope grid surface of the evaluation year.
3.3.4. Maintenance grid surface calculation
The maintenance grid surface is calculated based on the slope grid surface of each year, and the maintenance grid surface of the reference year is the same as the slope grid surface. By comparing the slope grid surface of a certain year with the maintenance grid surface of the previous year, if the grid values are equal, then the maintenance grid surface of the grid is assigned the same value as the previous year, otherwise it is assigned 0.
where P(ti) is the maintenance grid surface for the evaluation year; P(ti–1) is the maintenance grid surface from the previous year; S (ti) is the slope grid surface for the evaluation year; and S (t' ) is the slope grid surface of the reference year.
3.3.5. Exponential decay fitting
This study has normalized the number of maintenance grids in other years based on the number of maintenance grids in the reference year, i.e., calculates the proportion of the number of maintenance grids in each year to the number of maintenance grids in the reference year. The exponential decay function is used to fit the trend of the proportion of positive and negative sustained grids decreasing over time. The calculation formula for decay time (τ) is as follows:
where τ is the trend decay time (a); λ is a constant.
3.3.6. Calculation of CSR in ecosystems
The longer the decay time of a positive or negative trend, the higher the probability of maintaining the trend. The CSR of an ecosystem is measured by the difference between the decay time of a positive trend and the decay time of a negative trend. When the decay time of a positive trend is greater than that of a negative trend, it indicates that the CSR of the ecosystem is strong, and vice versa. The calculation formula is as follows.
Where τp is the decay time to maintain a positive trend; τn is the decay time to maintain a negative trend.
4. Result analysis
4.1. Change trend of carbon sinks of ecosystem in China
The inter-annual variation trend and spatial distribution characteristics of NPP in VCA in China (Figure 2) indicated that NPP in VCA of China exhibited an overall increasing trend, with an average growth rate of 1.66 g C m−2 yr.−1. Compared to 1981, NPP increased by 15.55%, indicating that the overall vegetation coverage in VCA of China was gradually improving. The NPP in 1982 was the smallest, only 276.86 g C m−2 yr.−1, and the peak NPP occurred in 2018, reaching 341.25 g C m−2 yr.−1. The total net increase of NPP in China over the past 38 years was 0.32 P g C. In the entire VCA area (8.42 million km2), the area with an increasing trend of NPP was 6.856 million km2, accounting for 81.44% of VCA area (31.86% for significant increase and 49.58% for insignificant increase), while the area with a decreasing trend of NPP was only 1.56 million km2, accounting for 18.56% of VCA area (4.26% for insignificant decrease and 14.30% for significant decrease). This indicated that most regions were characterized by an increase in carbon sequestration, mainly concentrated in provinces such as central and southwestern China, including Shanaxi (SAX), Shanxi (SX), Henan (HN), Hebei (HB), Shandong (SD), Guangzhou (GZ), Chongqing (CQ), Hunan (HUN), and Hubei (HUB), while NPP reduction areas were mostly concentrated in Inner Mongolia (IM) of northern China and coastal large city areas, such as Shanghai (SH), Guangdong (GD), Hon kong (HK), and Macau (MC). There had also been a significant increase in NPP in large areas of the Qinhai-Tibet Plateau and Xinjiang (XJ).
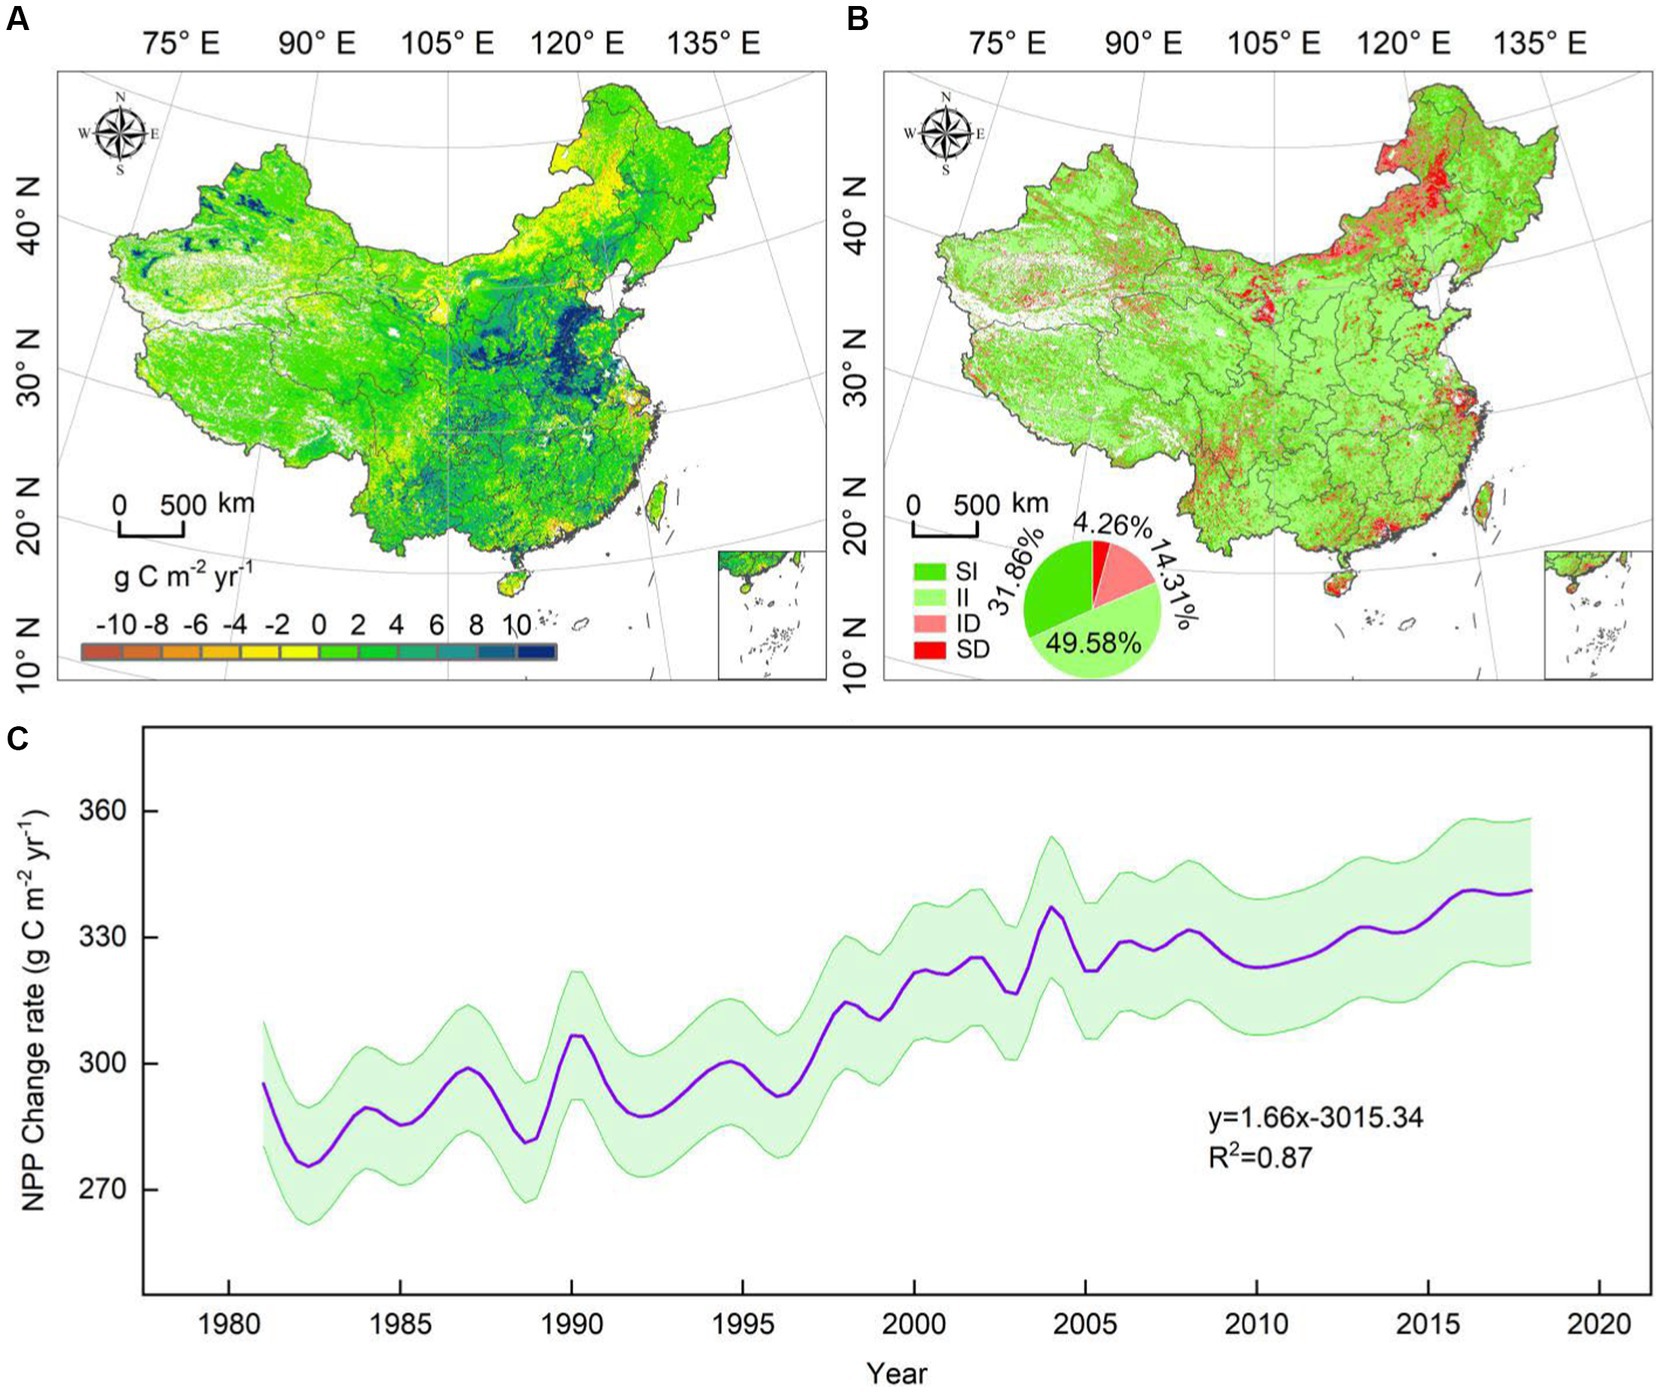
Figure 2. Evolution trend and spatial distribution of NPP in China from 1981 to 2018. (A) The evolution rate of carbon sinks in China; (B) The significant characteristics of NPP changes in China; (C) Annual variation characteristics of NPP in China. The SI, II, ID, and SD in (B) represents the change degree of significant increase, insignificant increase, insignificant decrease, and significant decrease in (A) respectively.
4.2. The CSCC and increase potential in China
The CSCC and NPP increase proportion of VCA in China were calculated based on NPP data obtained from remote sensing observations (Figure 3). It could be seen that the average CSCC was 658.59 g C m−2 yr.−1. Overall, the average CSCC in southern China was higher than that in northern China, while the CSCC in eastern China was generally higher than that in western China. As shown in Figure 4A, NPP in various regions had exceeded 60% of CSCC in each year, and as the years increased. And the degree of saturation also showed an increasing trend year by year. By 2018, the potential for NPP improvement of China was 0.88 Pg C, accounting for 27% of the total NPP value of that year (3.26 Pg C). And the total NPP in that year also increased to 78.74% of the CSCC (4.13 Pg C), which had increased by 23.26% compared to the lowest value in 1982. Based on the total NPP in 2018, there was still 21.26% potential for NPP increasing in the future.
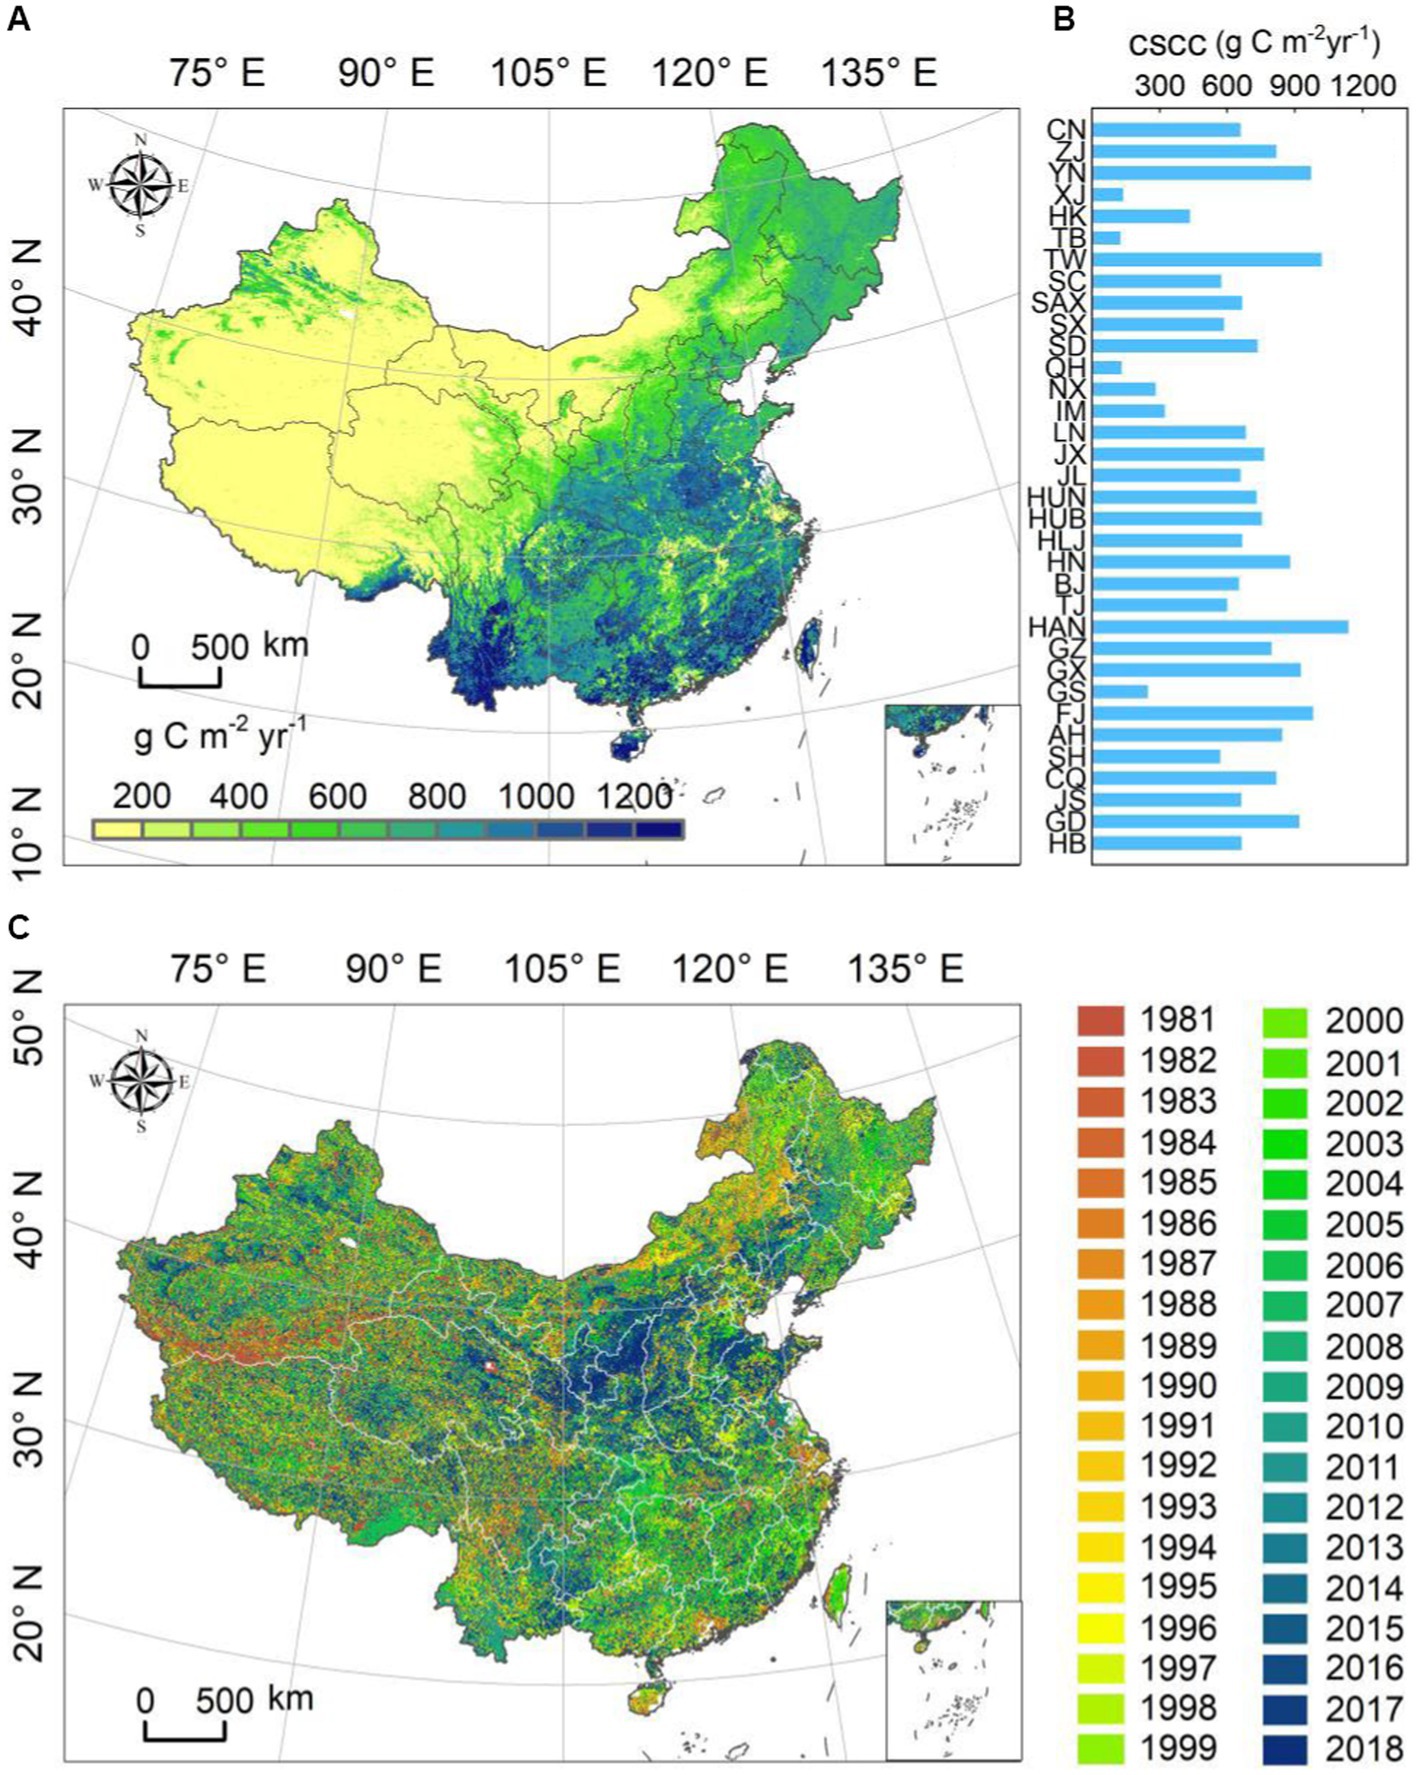
Figure 3. Spatial distribution and temporal characteristics of CSCC in China. (A) The spatial distribution characteristics of CSCC in China; (B) The CSCC in China and various provinces; (C) The temporal distribution characteristics of CSCC in China.
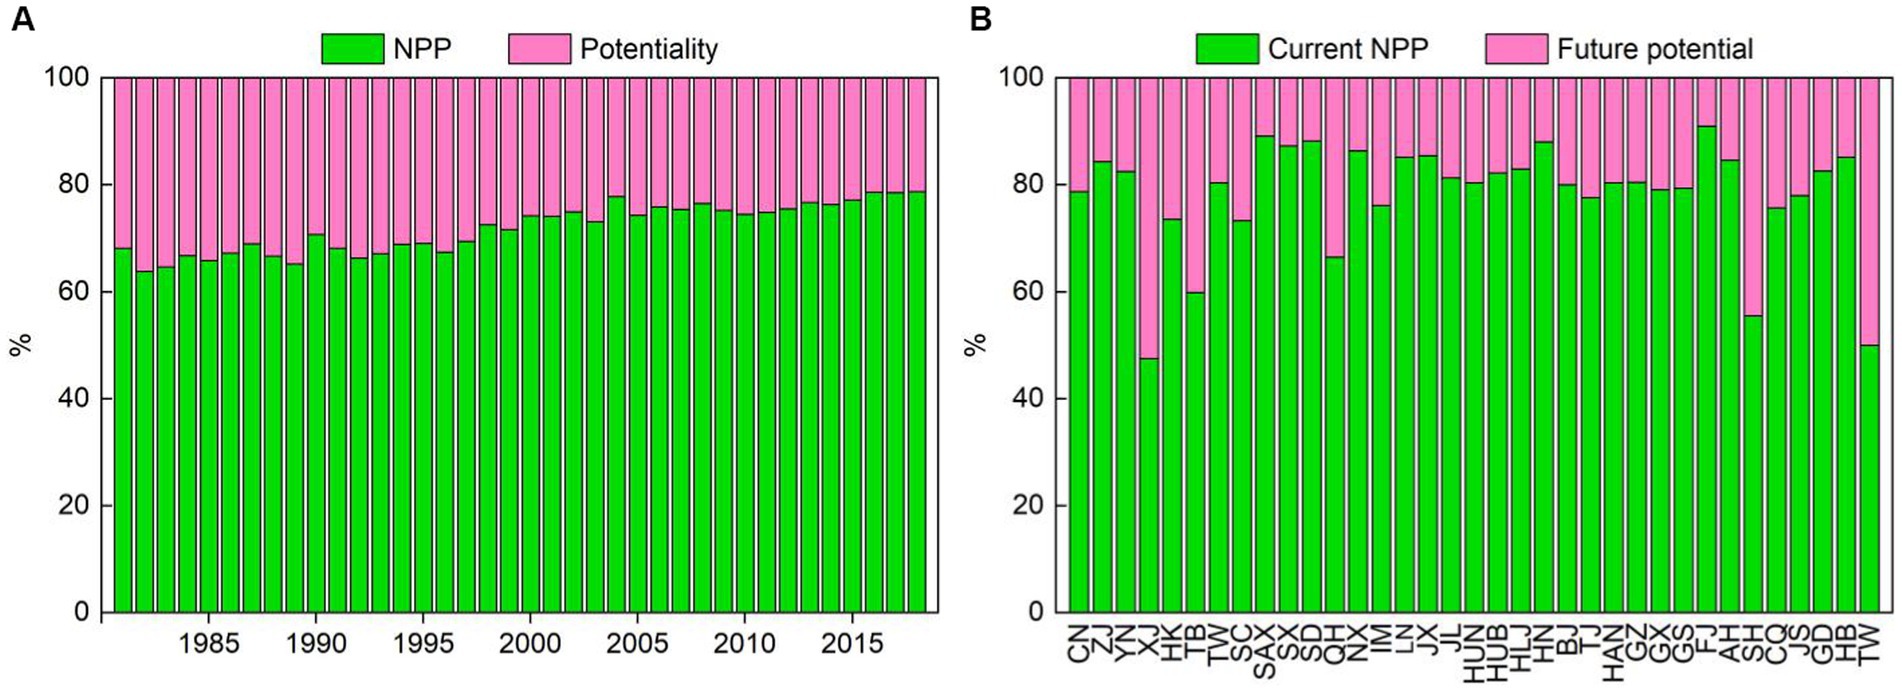
Figure 4. NPP Change trends and the increase proportion in the future. (A) The characteristics of NPP capacity changes over the years and the proportion that can be increased in the future; (B) The current (2018) NPP capacity of each province and the proportion that can be increased in the future.
It was found that the CSCC in western provinces of China was generally low based on spatial analysis, less than 200 g C m−2 yr.−1. The areas with high CSCC value were mainly distributed in Yunnan (YN) (972.24 g C m−2 yr.−1), Guangxi (GX) (925.91 g C m−2 yr.−1), GD (918.39 g C m−2 yr.−1), CQ (817.51 g C m−2 yr.−1), Guizhou (GZ) (795.03 g C m−2 yr.−1), HUB (752.61 g C m−2 yr.−1), HUN (728.72 g C m−2 yr.−1), and Shichuan (SC) (573.79 g C m−2 yr.−1). It could be seen that southern China was the largest CSCC region in China, with CSCC mostly exceeding 800 g C m−2 yr.−1. At present, southern China might still be a region with significant potential for carbon sinks increasing in the future, with carbon sequestration potential exceeding 20%. The total carbon sequestration in these regions could be further increased by 58.11, 40.03, 23.19, 15.30, 24.79, 23.45, 27.64, and 69.91 Tg C yr.−1 (Table 1), respectively. Coastal provinces such as Fujiang (FJ), Hainan (HAN), Zhejiang (ZJ), and Taiwan (TW) had significant carbon sinks potential, but the potential for carbon sinks increasing in the future was relatively small due to the current high NPP.
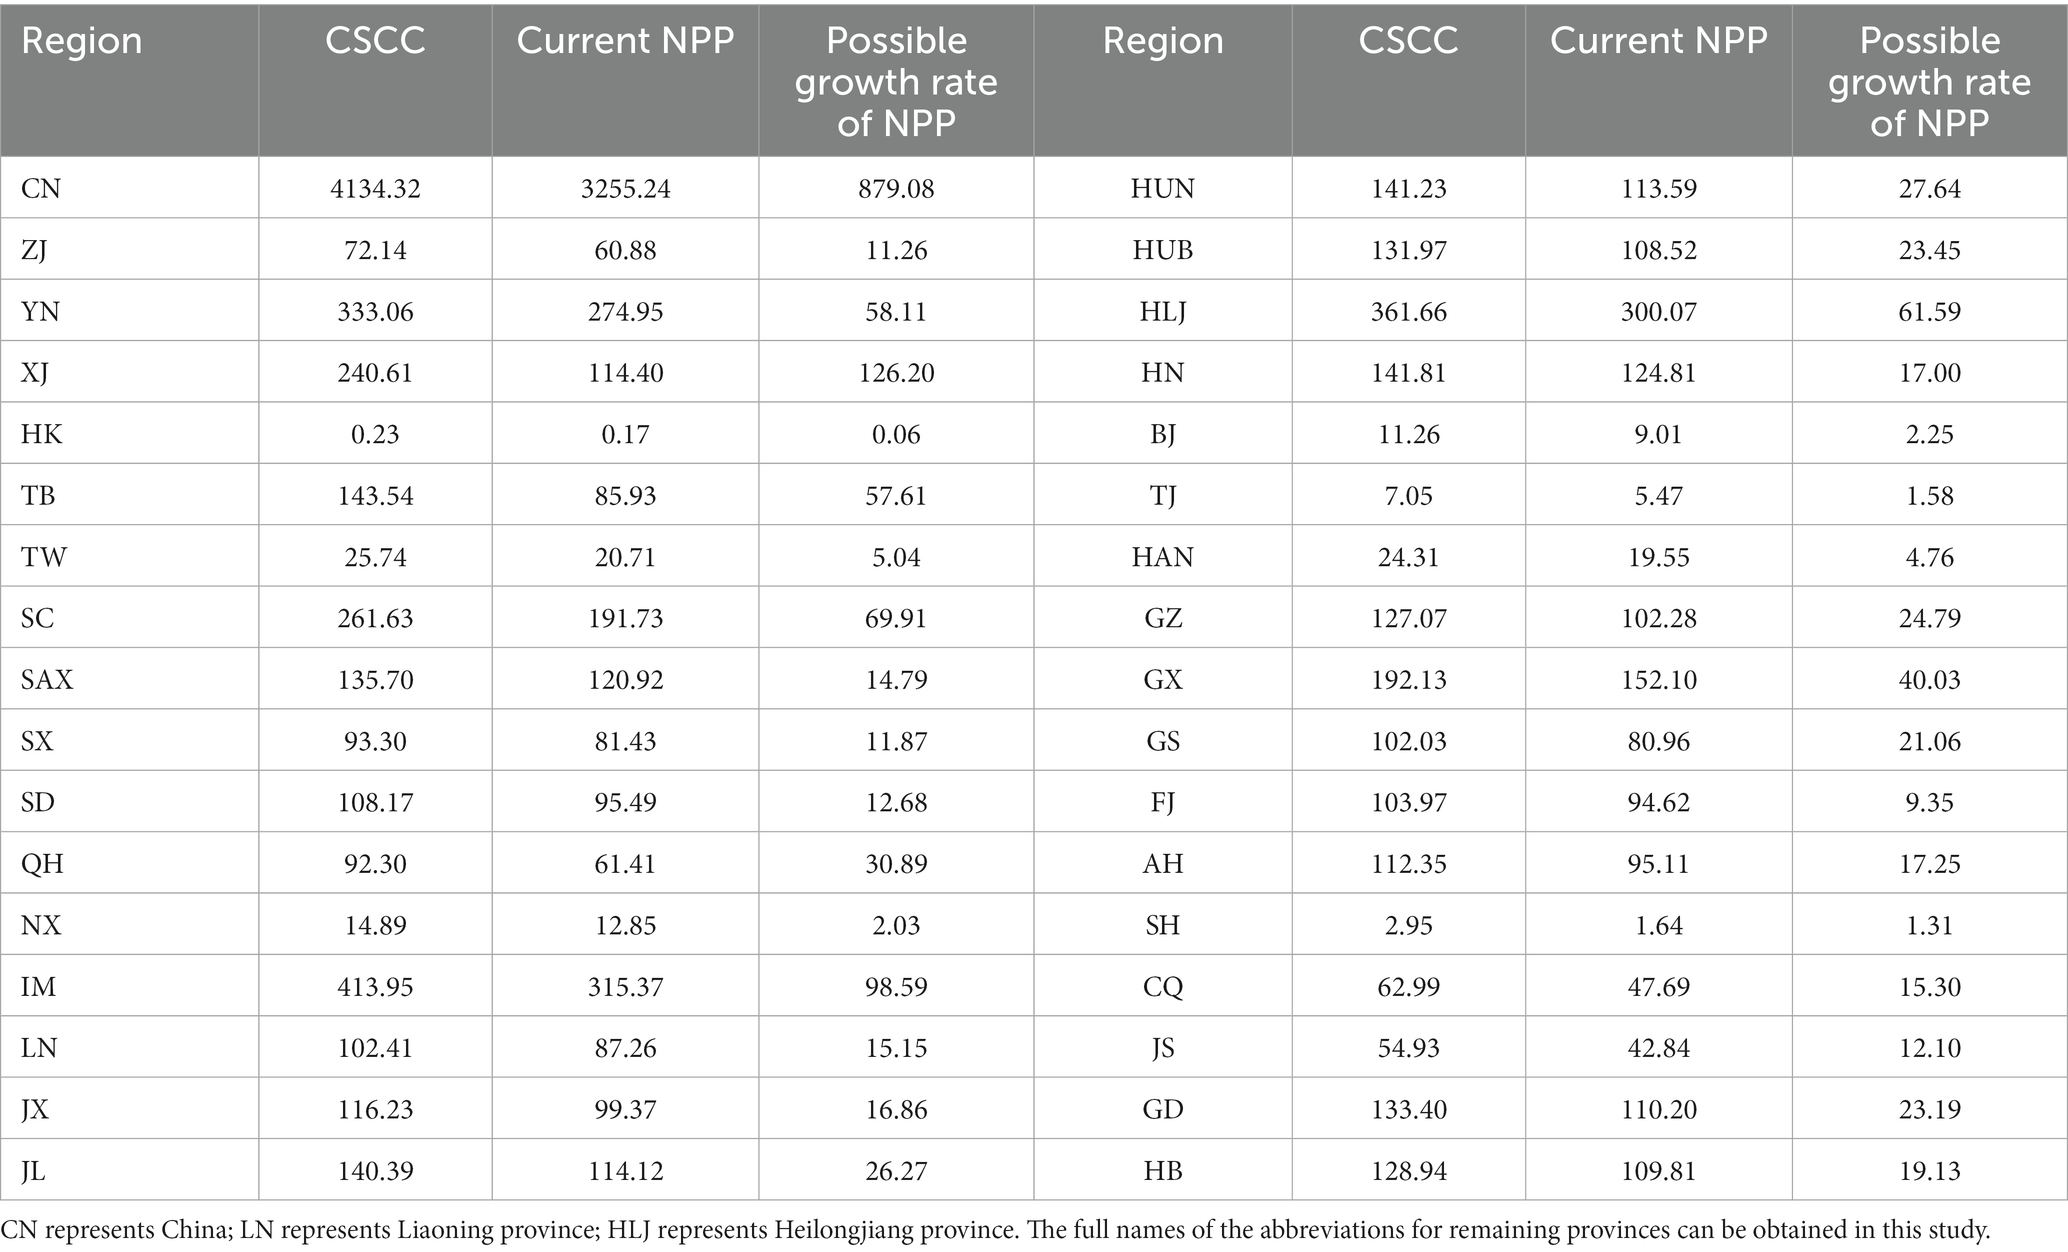
Table 1. CSCC, current situation, and possible growth rate of NPP in China (CN) and provinces (Tg C yr.−1).
The possible growth rate of NPP was also low in the North China Plain [Beijing (BJ), Tianjin (TJ), HB, SD, HN, Anhui (AH), and Jiangsu (JS)] with high CSCC and the Loess Plateau [SAX, SX, GS, Ningxia (NX)] with low CSCC, only about 10–20% (Figure 4B). From a national perspective, the Qinhai-Tibet Plateau was a region with low CSCC. However, due to the current low NPP state, there was still 20–50% of the carbon sink increase space in the future, which might be the regions with the highest potential for carbon sinks increasing in the future. Among them, XJ had the highest potential for carbon sequestration improvement, reaching 52.45%, followed by Tibet (TB) and Qinghai (QH), with 40.13 and 33.46%, respectively.
The CSCC was detected to occur after 2015 in the Loess Plateau region, indicating that the CSCC might still maintain a sustained growth trend (Figure 3C). For other regions, the CSCC had been detected to occur for many years. Among provinces, such as QH, TB, and XJ, nearly half of the regions had already detected the CSCC in 2000, while the southern XJ and northern and northwestern IM had already reached their maximum NPP before 1990. Most regions in southern China had experienced carbon sink peaks after 2000, indicating that these regions had been recovering in recent years and were far from returning to their previous peaks. Overall, which might not be able to predict the CSCC except for the Loess Plateau, most regions in China had already experienced the peak potential for NPP and had been in a state of rapid recovery for a long time. From the changes in the increase range of carbon sinks based on CSCS for the main years in the starting period (Figure 5), it could be seen that the potential differences of NPP in most regions were increasing, indicating that NPP in these regions were decreasing and the gap with CSCC was increasing. However, the difference for the increase range of carbon sinks in fitting years was gradually decreasing (Figure 6), indicating that NPP in these regions were showing a growing trend.
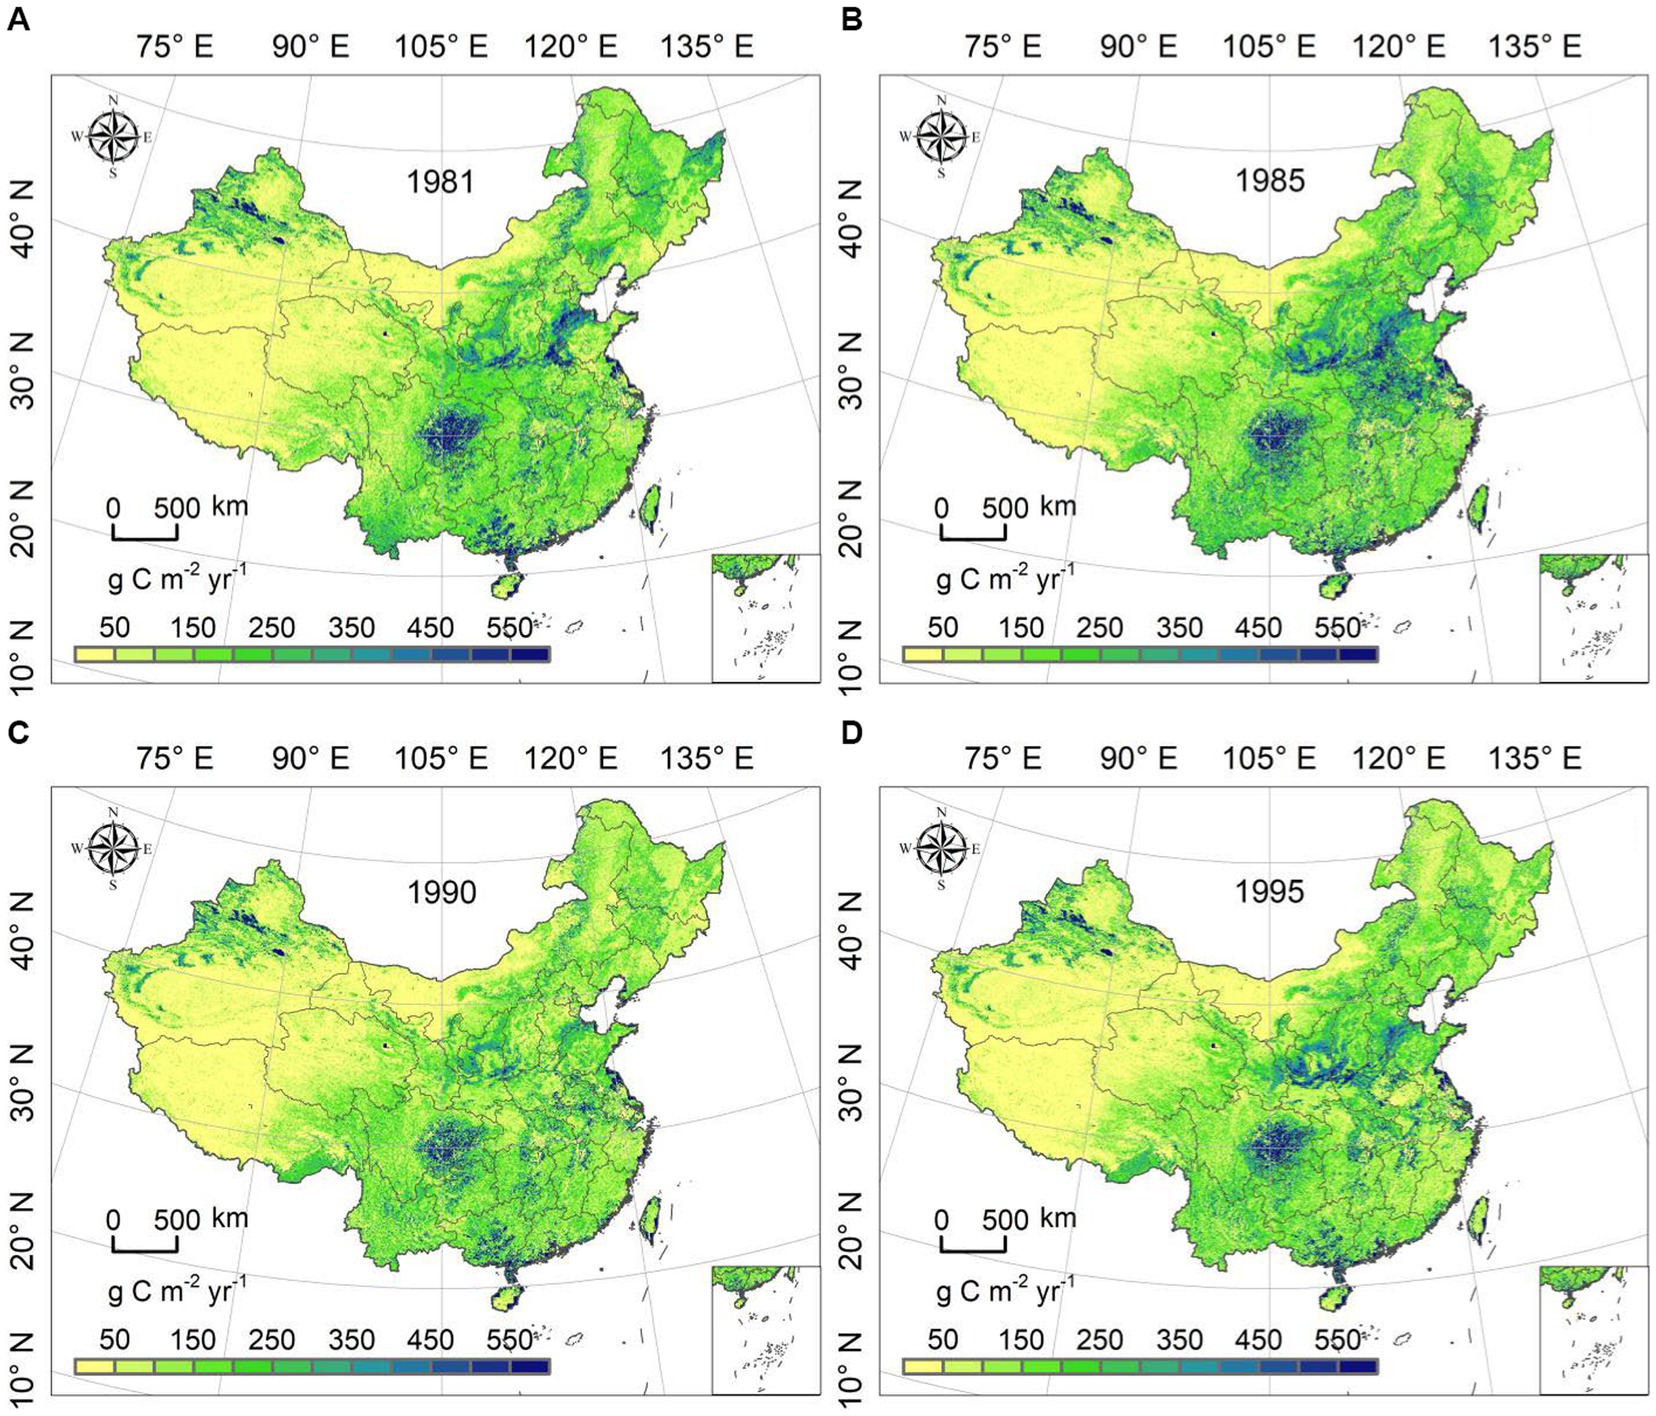
Figure 5. The increase range of NPP based on CSCS for the main years in the starting period based on remote sensing observations. (A) The increase range of NPP based on CSCS in 1981 based on remote sensing observations. (B) The increase range of NPP based on CSCS in 1985 based on remote sensing observations. (C) The increase range of carbon sinks based on CSCS in 1990 based on remote sensing observations. (D) The increase range of carbon sinks based on CSCS in 1995 based on remote sensing observations.
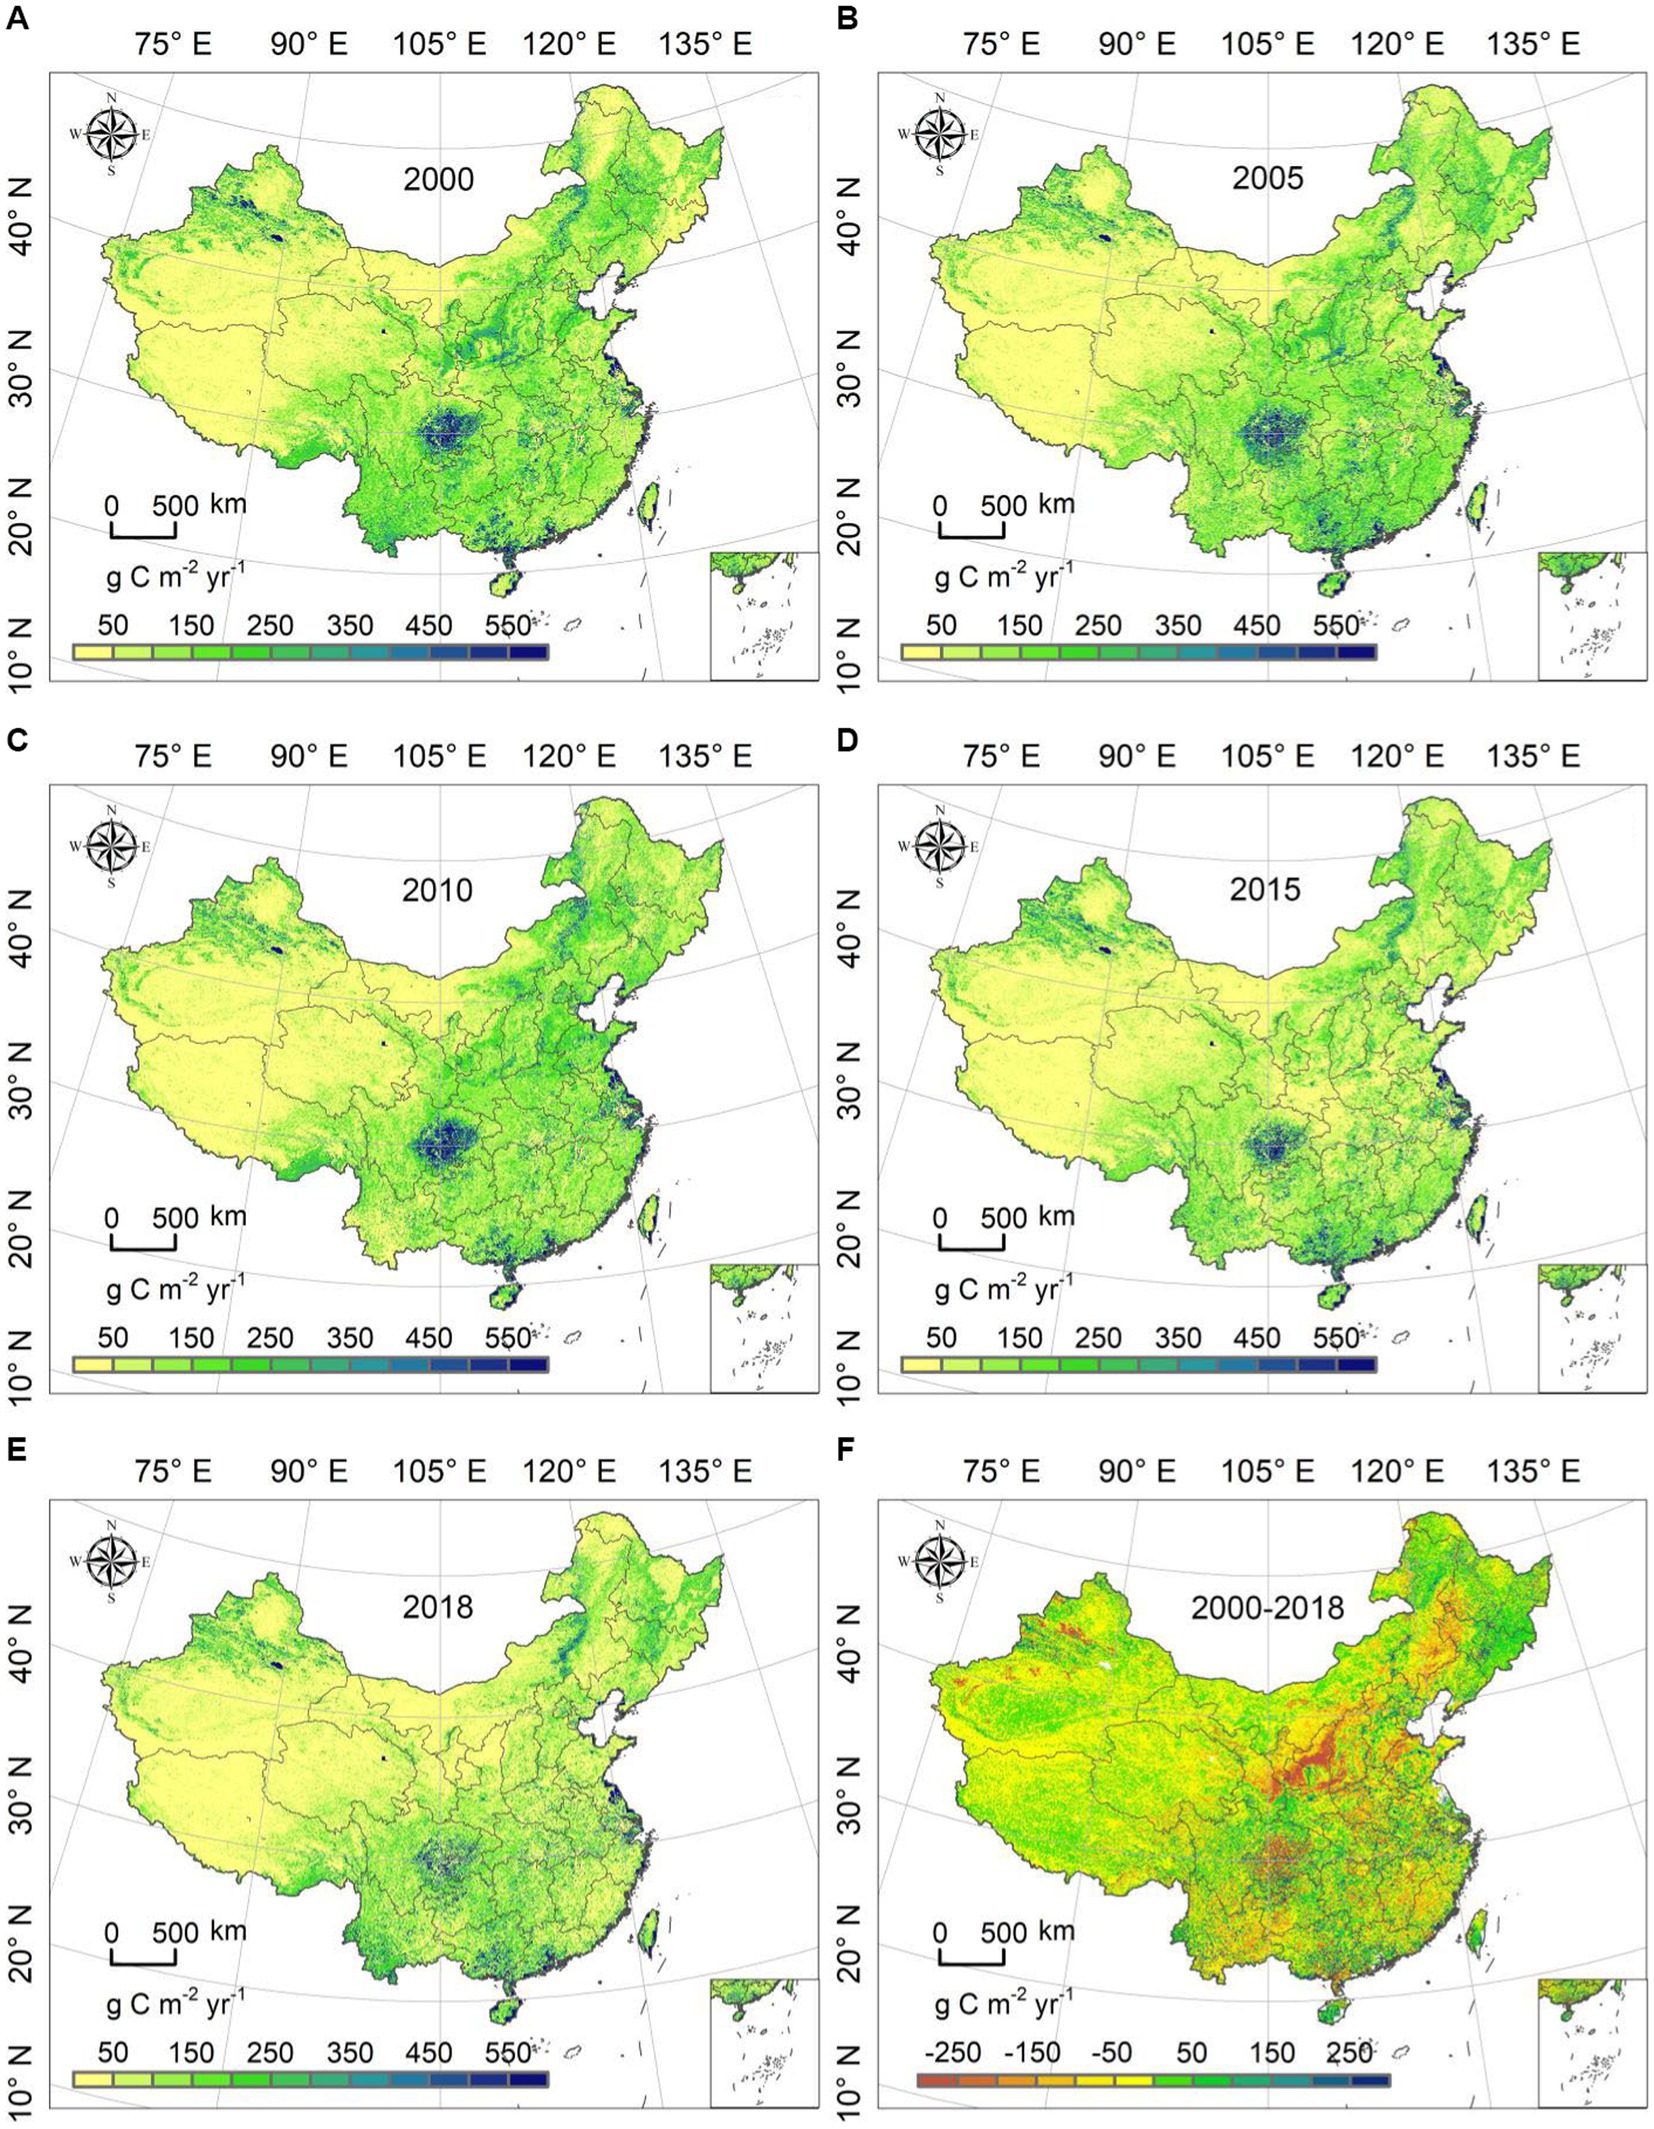
Figure 6. The increase range of NPP based on CSCS for the main years in the fitting period based on remote sensing observations. (A) The increase range of NPP based on CSCS in 2000 based on remote sensing observations. (B) The increase range of NPP based on CSCS in 2005 based on remote sensing observations. (C) The increase range of NPP based on CSCS in 2010 based on remote sensing observations. (D) The increase range of NPP based on CSCS in 2015 based on remote sensing observations. (E) The increase range of NPP based on CSCS in 2018 based on remote sensing observations. (F) The differences of the increase range of NPP based on CSCS between 1981 and 2018 based on remote sensing observations.
4.3. Changes in the number of maintenance grids
In order to explore the maintenance characteristics of NPP evolution, this study had counted the number of grids that maintained positive and negative trends in NPP changes from 2000 to 2018, and had calculated the proportion of maintenance grids in each year to the number of grids that maintained the same trend in 2000 (Table 2). Over time, the number of NPP grids maintaining a negative trend decreased significantly and rapidly (4,162 yr.−1), while the number of inverted grids increased significantly (6,211 yr.−1) In 2018, the number of NPP changes maintaining a negative trend grid was only 19.55% of that in 2000. However, the number of NPP grids that maintained a positive trend in changes accounted for 74.96% of that in 2000, indicating that the NPP in VCA in China maintained a positive succession as a whole.
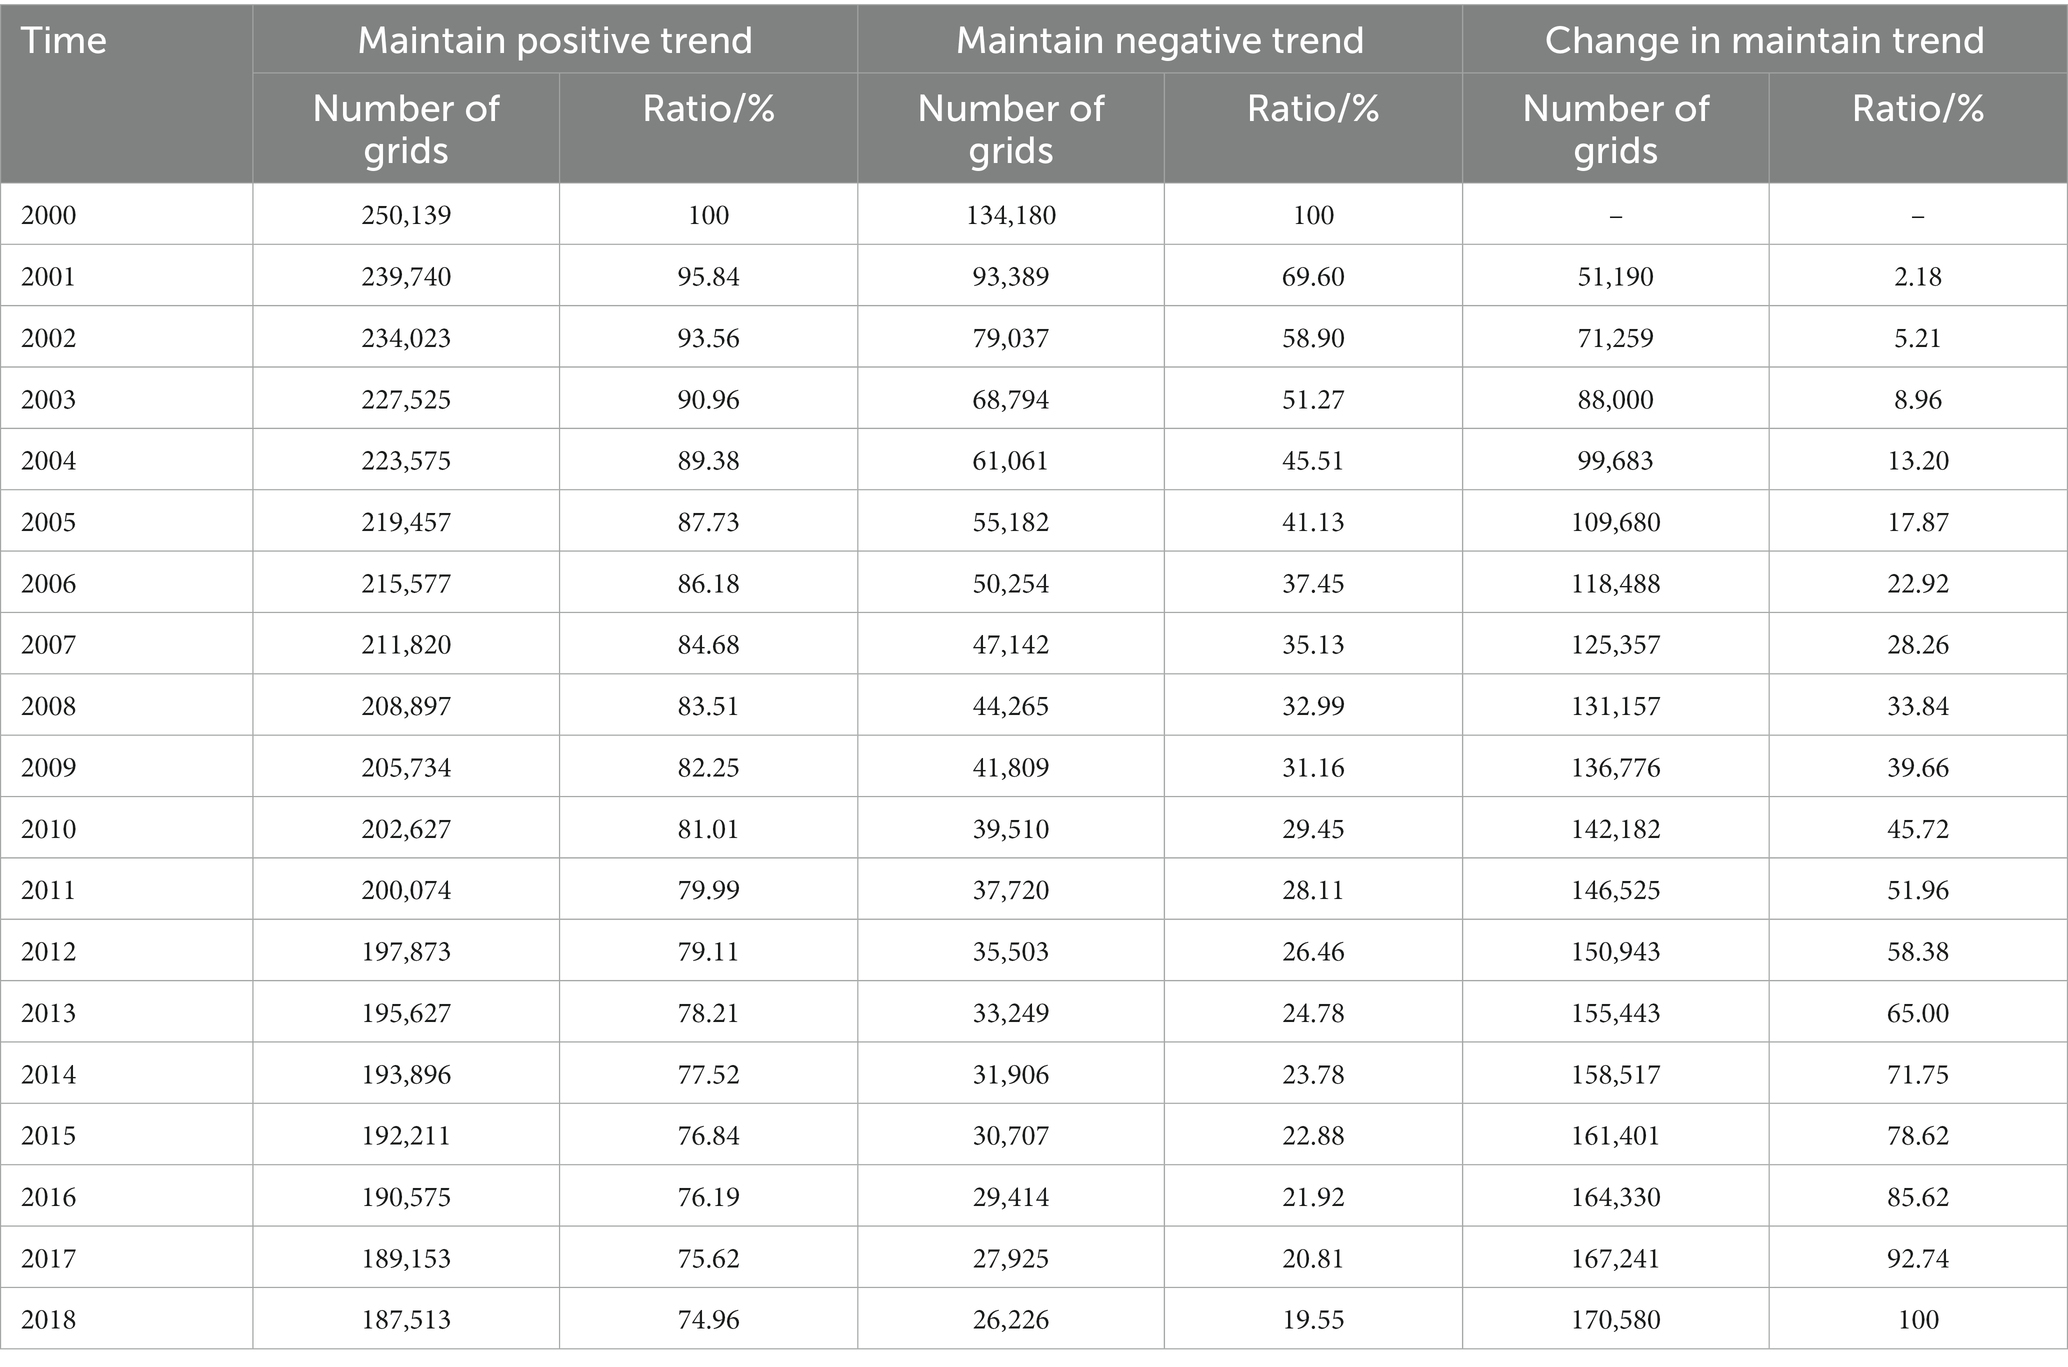
Table 2. Change Characteristics of the number of NPP maintained grids with positive and negative trends in China from 2000 to 2018.
From a spatial perspective, the regions maintaining the positive trend were mainly concentrated in the North China Plain and the Loess Plateau in central China, while the regions maintaining the negative trend were mainly concentrated in the southwest alpine mountains and the northwest and northern arid regions (Figure 7). Over time, the regions maintaining the negative trend shrank gradually, transformed rapidly, and maintained the positive trend ultimately.
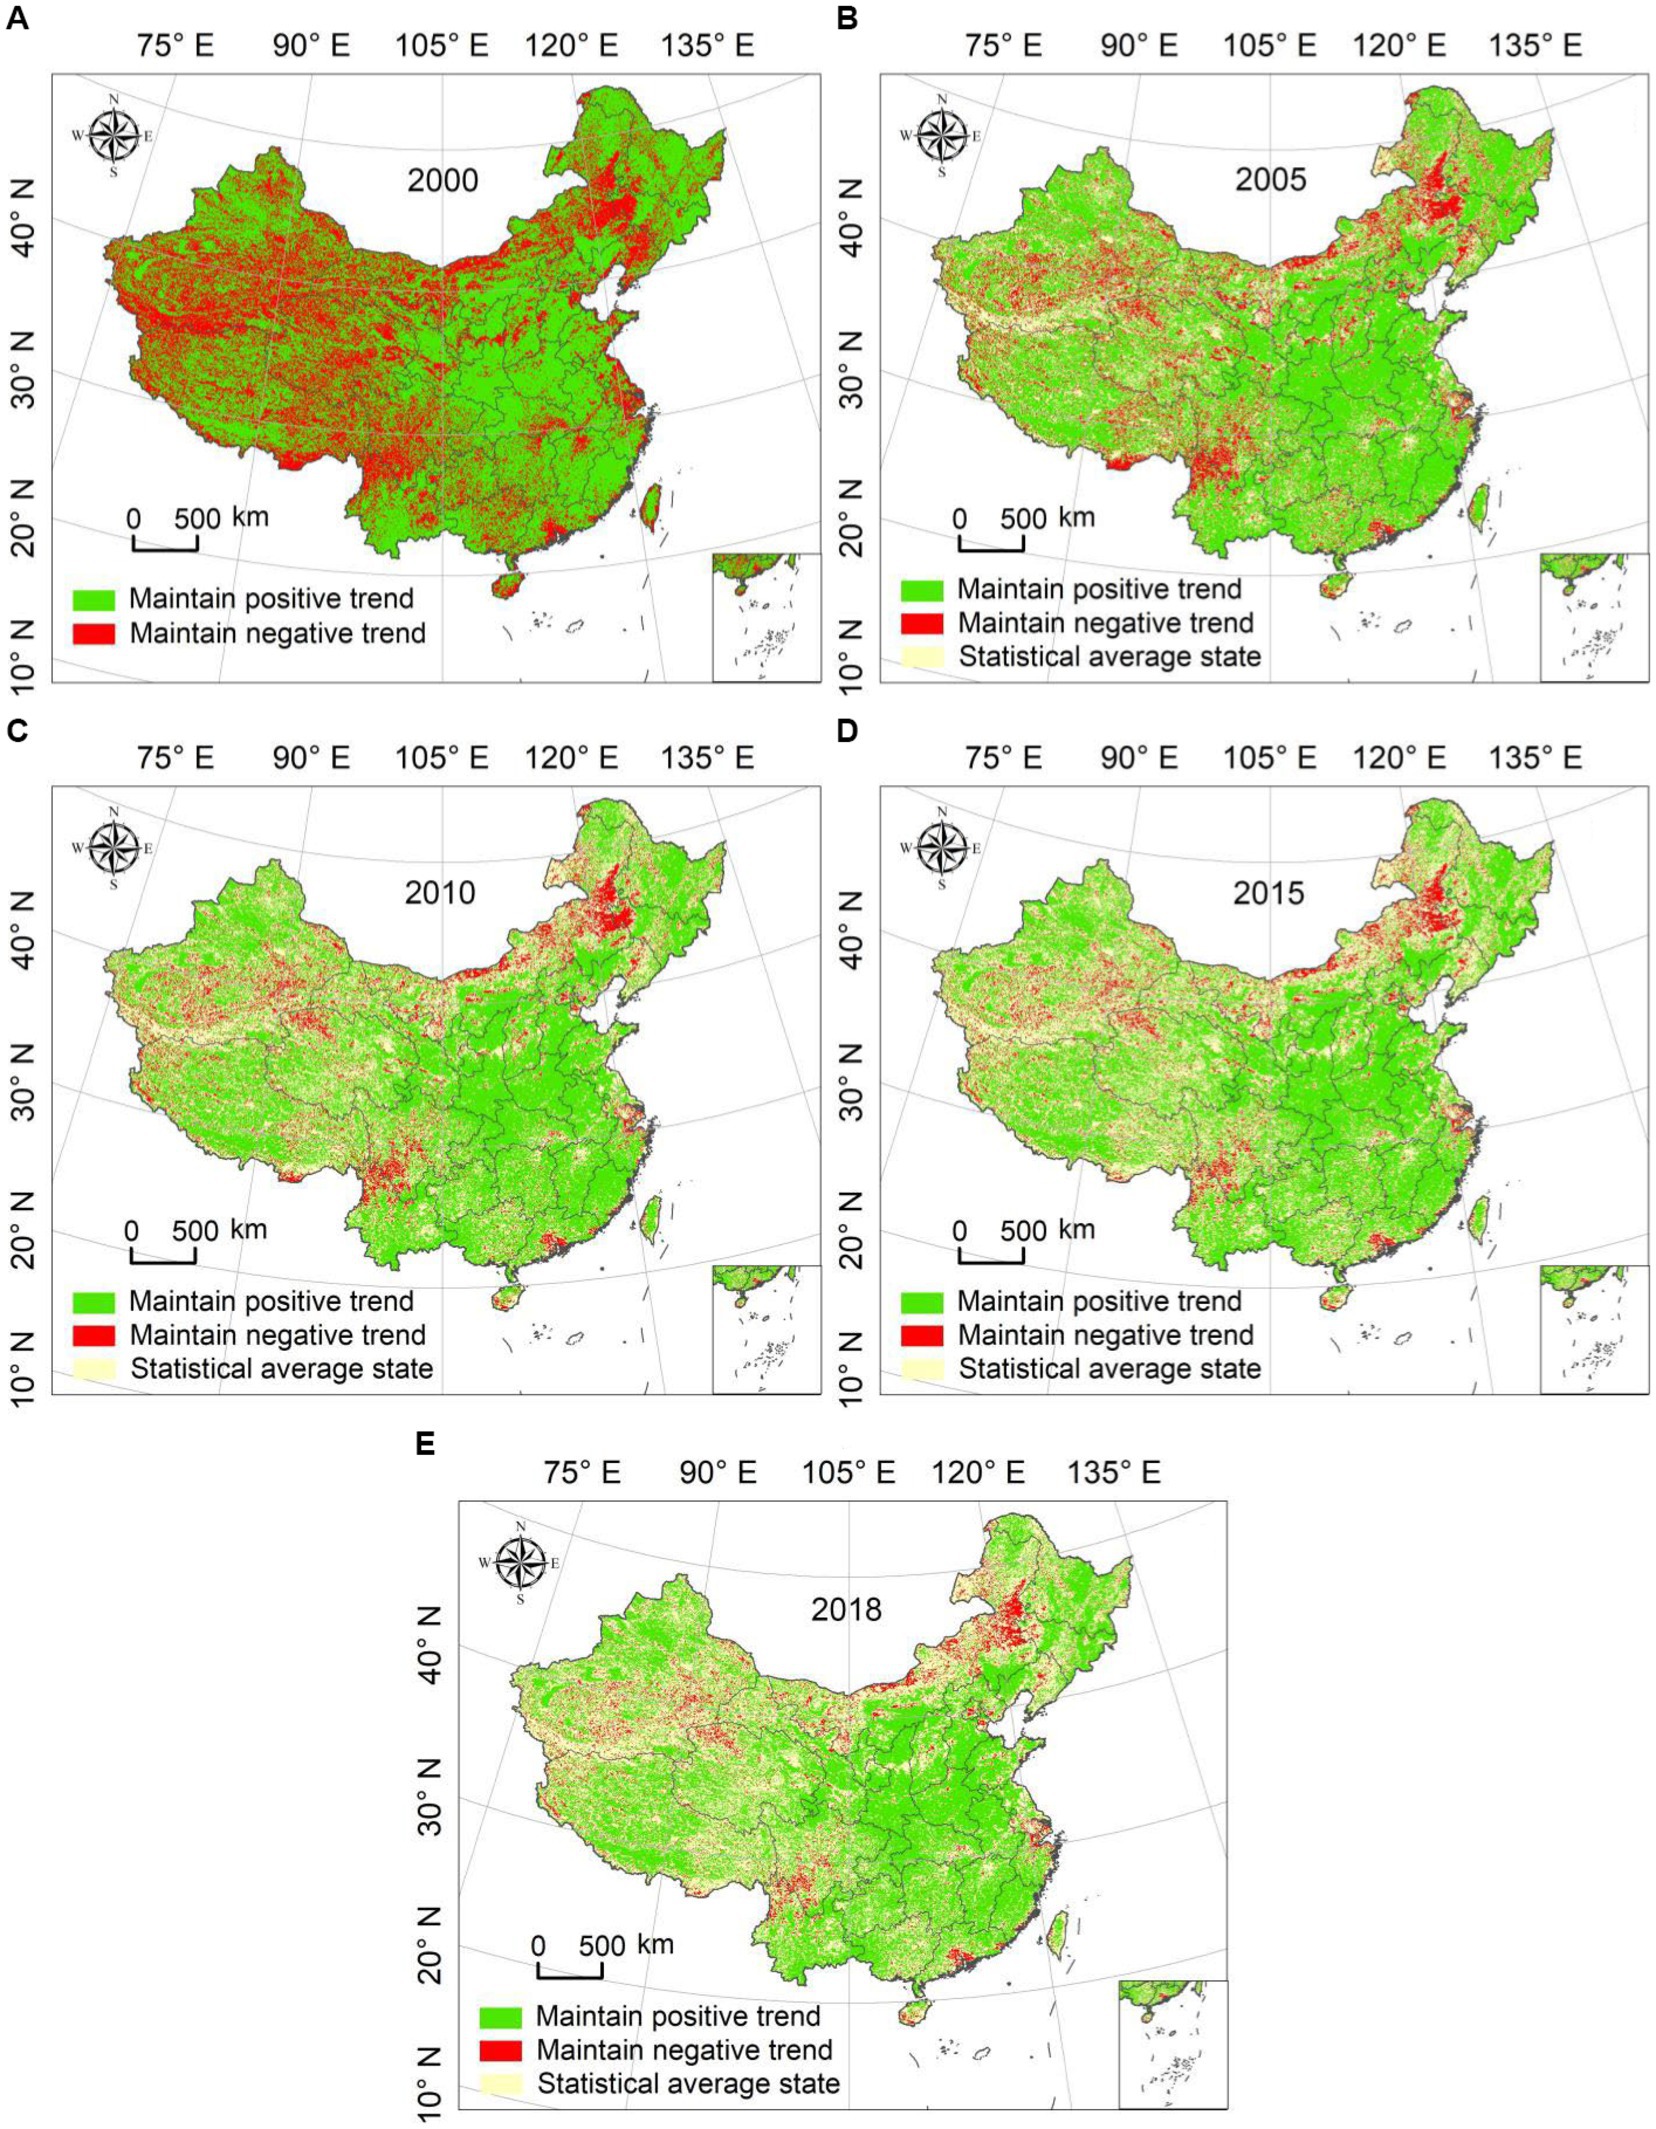
Figure 7. The maintainability characteristics of NPP in fitting years based on remote sensing observations. (A) The maintainability characteristics of NPP in 2020 based on remote sensing observations. (B) The maintainability characteristics of NPP in 2005 based on remote sensing observations. (C) The maintainability characteristics of NPP in 2010 based on remote sensing observations. (D) The maintainability characteristics of NPP in 2015 based on remote sensing observations. (E) The maintainability characteristics of NPP in 2018 based on remote sensing observations.
The spatial analysis method was used to stack the maintenance grids from 2000 to 2018 to obtain the times that each grid maintained the same trend in 19 years (Figure 8). The more years a positive trend maintained (darker in blue), the longer it lasted, the better the recovery effect of vegetation carbon sink would be, while the more years a negative trend maintained (darker in red), the longer the negative trend maintained, and the worse the recovery effect of vegetation carbon sink would be. From a spatial perspective, the regions maintaining the positive trend for a long time were mainly distributed in SAX, HN, HUB, AH, HUB, HUN, JX, FJ, GX, GD, GZ, YN, CQ, and other regions, with a positive trend maintained more than 10 times. However, the regions that maintaining the negative trend for a long time were mainly distributed in arid regions such as XJ, QH, and northern IM, as well as high and cold areas in southwest China, where the frequency of maintaining a negative trend was relatively high. The spatial distribution based on the superposition of positive and negative trends showed that the provinces in the Loess Plateau, North China Plain and South China were the regions with more years of maintaining positive trends for 19 years. However, the change trend in arid and high cold regions was mostly negative with maintenance years mostly exceeding 5 years.
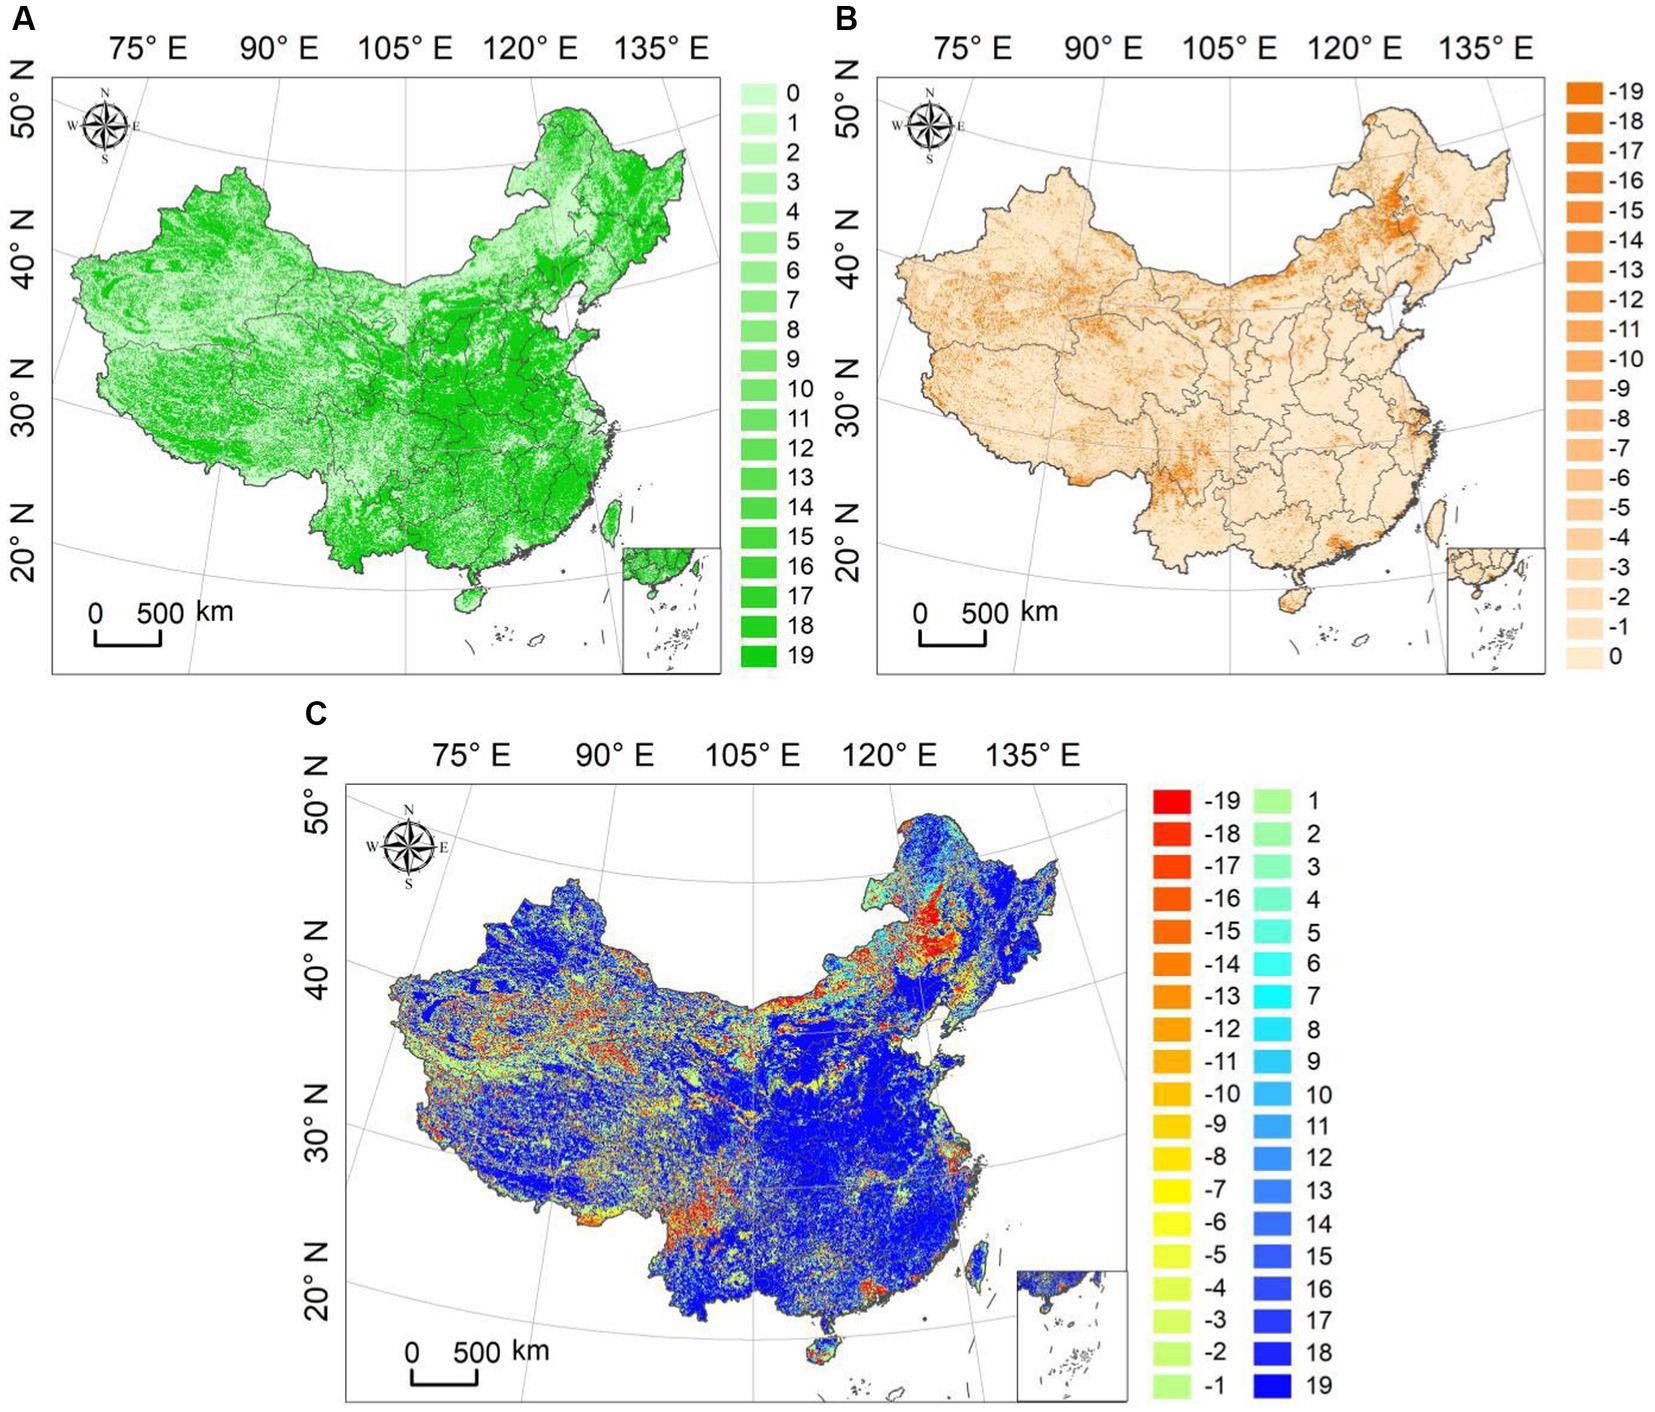
Figure 8. The grid maintenance trend frequency of NPP in China’s ecosystem from 2000 to 2018. (A) Maintain a positive trend frequency; (B) Maintain negative trend frequency; (C) The number of spatial stacking times to maintain a positive and negative trend.
4.4. CSR of ecosystems in China and various provinces
In order to quantitatively estimate the CSR of ecosystems, this study had used the proportion of the number of positive and negative trend grids maintaining from 2000 to 2018 to the reference time (2000) as the vertical axis, the time as the horizontal axis, and obtained the CSR of ecosystems in China and various provinces based on fitting trend decay curves. The results demonstrated that the decay time for maintaining a positive trend in vegetation carbon sink of China was 196 years, while the decay time for maintaining a negative trend was 7 years, with a difference of 189 years (Figure 9A). This indicated that the total vegetation carbon sink of VCA in China showed a recovery state after 2000 due to the interference of the previous period. According to the range and ranking of ecosystem CSR in China and various provinces, the CSR was classified into five levels: (1) Ranking >500, indicating extremely strong resilience of vegetation carbon sink; (2) Ranking 100–500, indicating that the stronger resilience of vegetation carbon sink; (3) Ranking 0–100, indicating strong resilience of vegetation carbon sink; (4) Ranking <0, indicating weak resilience of vegetation carbon sink; Ranking<−100, indicating that the weaker resilience of vegetation carbon sink. Based on this, the CSR of ecosystem in China was in a strong state now.
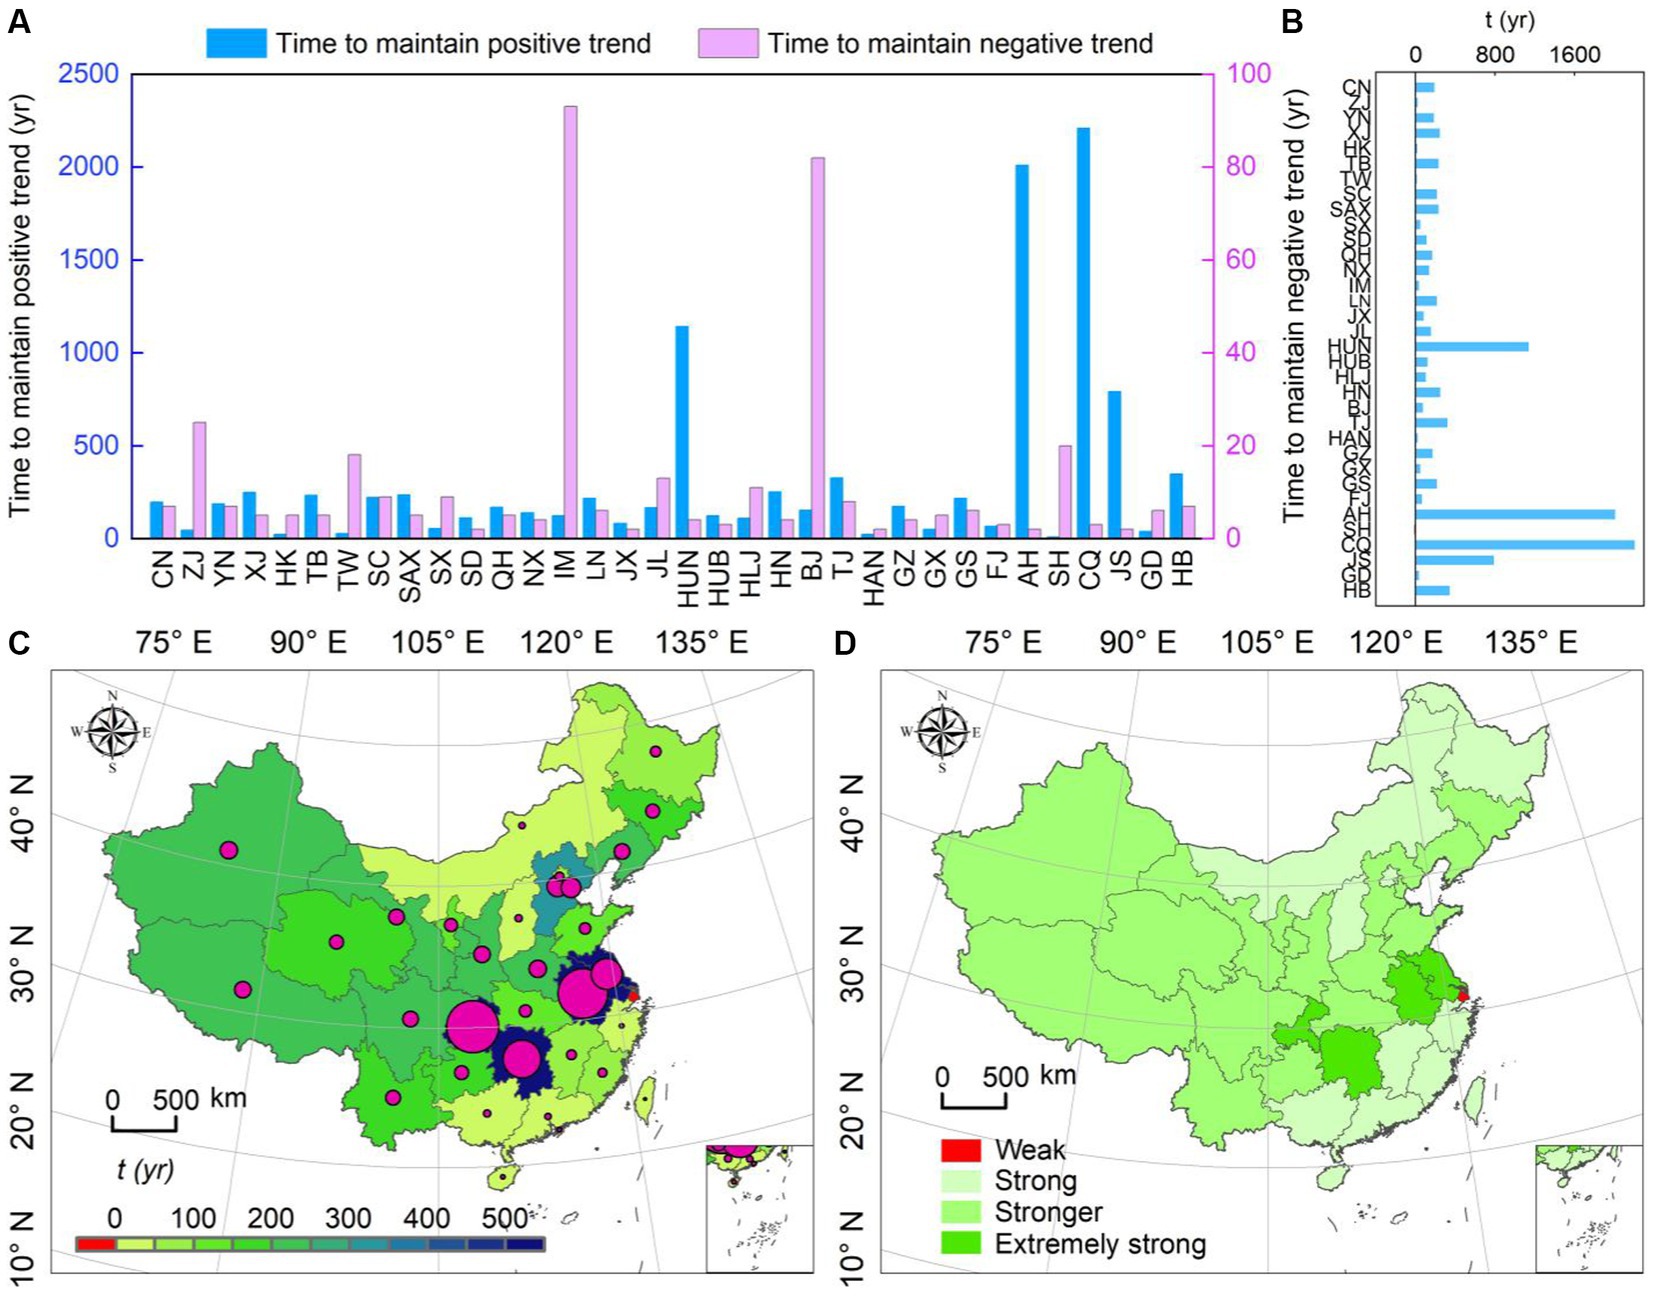
Figure 9. Characteristics of CSR in ecosystems of China and various provinces. (A) The time when the carbon sink of ecosystems in China and various provinces maintains a positive and negative trend; (B) CSR of ecosystems in China and various provinces; (C) Spatial characteristics of CSR of ecosystems in China and various provinces; (D) The grade level of CSR of ecosystems in China and various provinces.
Due to the scale of research, the number of grids maintaining positive and negative trends in some provinces and regions gradually decreased and tended to stabilize, leading to some abnormal results during fitting. Some regions that maintained a positive and negative trend grid from 2000 to 2018 would remain unchanged after a certain period of decay. For this situation, this study had considered the decay time to be the time when the positive and negative trends converge. As shown in Figure 9, the provinces that had maintained a negative trend for a long time were IM, BJ, ZJ, and SH, with a duration of 93, 82, 25, and 20 years, respectively. For other provinces, the duration of maintaining a negative trend was relatively short. The four provinces of HUN, CQ, AH, and JS had maintained a positive trend for a much longer period of time and resilience than other provinces, with periods of 1,143, 2,210, 2010, and 791 respectively, and recoveries of 1,139, 2,207, 2008, and 789 years, respectively (Figures 9B,C), indicating that the ecological system carbon sinks of these provinces were at a extremely strong level of resilience (Figure 9D). The CSR of ecosystems in the central and western provinces was relatively high, showing a strong level of resilience. But, the CSR in the southeast (GX, GD, ZJ, JX, FJ, and JS) and northern provinces (IM, SX, and HLJ) was relatively low, showing a strong level of resilience. Only SH, affected by urban expansion, showed a positive maintenance trend of 10 years and a negative trend of 20 years, showing a negative trend and weak resilience (−10 years).
5. Discussion
5.1. Comparisons of the results with that in previous studies
This study had identified CSCC in China based on the reachable NPP in the past and diagnosed the potential for future NPP improvement. Research findings revealed that China had a huge carbon sink and potential for future carbon sink enhancement, and it had been found that China and various provinces had strong carbon sink resilience through nearly 20 years of identification. Such insights were more scientific and reasonable, as the CSCC of each region was the highest value that had truly been achieved in the past, compensating for the uncertainty of the CSCC simulated by the model. This was because the CSCC simulated by ecological process model might not take into account the limitations of various climate conditions, resulting in overestimation of the results. The research results can provide more scientific guidance for ecological restoration construction, carbon sink potential assessment, and the formulation of carbon sink enhancement strategies. Since the late 20th century, numerous studies had shown that China had improved vegetation coverage and terrestrial carbon sinks through ecological restoration. From 2000 to 2015, the average NPP of land vegetation in China was 273.5 g m−2 yr.−1, with a change rate of 1.42 g C m−2 yr.−1. The annual total NPP of terrestrial vegetation in China fluctuated between 2.41 and 2.81 Pg yr.−1, with an average value of 2.64 Pg yr.−1 (Li and Wang, 2018). It was found that the average CSCC value in China ranges from 468.94 to 663.62 g C m−2 yr.−1 (Zhang et al., 2014; Ren et al., 2017; Pan and Xu, 2020; Bi and Pan, 2022) based on various ecological process models or empirical regression models. The average CSCC of China estimated based on the maximum synthesis method in this study was 658.59 g C m−2 yr.−1, indicating that the CSCC results of this study were reliable.
In terms of total amount, the CSCC of China constructed based on the GLASS NPP data product from 1982 to 2017 was 1.85 Pg C, which was lower than the optimal value of NPP in China constructed using the most widely used Miami model (9.15 Pg C) (Wan et al., 2022), but higher than the estimated annual average absorption of terrestrial ecosystem in China from 2010 to 2016 based on chemical transport mode resolution and representative site observation data (1.11 Pg C), and it was even higher than the international consensus that the terrestrial vegetation carbon sink of China was between 0.27 and 0.46 Pg C. The main reason was that there was limited observational information and different teams had significant differences in calculating the carbon sink of terrestrial ecosystems in China. Over the past 20 years, estimates of China’s terrestrial carbon sinks using various methods had consistently shown that China’s terrestrial ecosystem was an important carbon sink (Piao et al., 2022). Huang et al. (2022) believed that the average annual carbon sequestration of China’s terrestrial ecosystem would increase from 0.38 Pg C in 2010 to 0.46 ~ 0.49 Pg C in 2050. Among various terrestrial ecosystems, forest carbon sink intensity was the highest, accounting for 68 to 71%, farmland accounts for 12 to 13%, and other ecosystems (wetlands, grasslands, and shrubs) accounted for 17–19%. The current terrestrial carbon sink intensity in China was 0.2–0.25 Pg C yr.−1 based on the evaluation of previous research results, and it was expected to be between 0.15 and 0.52 Pg C yr.−1 by 2060 (Yang et al., 2022). Among them, the inventory method estimated China’s terrestrial carbon sink to be 0.21 ~ 0.33 Pg C yr.−1 (considering inland water carbon deposition~0.02 Pg C yr.−1) (Jiang et al., 2016), which was equivalent to the ecosystem process model estimation results (0.12 ~ 0.26 Pg C yr.−1). However, the results estimated based on the atmospheric inversion method had an significant uncertainty (0.17–1.11 Pg C yr.−1), and the land carbon sink estimated based on the atmospheric inversion model in China was 0.17–0.35 Pg C yr.−1, which was basically consistent with the estimation results based on the “bottom-up” inventory method. Yu et al. (2022) believed that the current carbon sequestration capacity of China’s terrestrial ecosystems was approximately 0.27–0.35 Pg C yr.−1. it was expected to achieve an annual carbon sink contribution of 0.55–0.68 Pg C yr.−1 between 2050 and 2060 by coordinating land river ocean spatial planning and various sink enhancement technologies. Thus, it can be seen that there are certain differences in the estimation results of different methods.
The huge terrestrial vegetation carbon sink of China was mainly due to the carbon sequestration contribution of important forest regions, especially the southwestern forest regions (YN, GZ, and GX). The prediction results based on the multi factor random forest model showed that the carbon carrying capacity of the largest aboveground biomass of forests in eight provinces and regions of southwest China was 20.54 Pg C yr.−1. The aboveground biomass carbon of forests increased by 2.34 Pg C yr.−1 from 2002 to 2017 under large-scale afforestation, and there was still 5.32 Pg C yr.−1 carbon sequestration potential in the future. Furthermore, their study had identified old forests, new forests, and potential afforestation areas that had not yet fully achieved carbon sequestration potential by applying forest land probability data from 2002 to 2017. It had found that potential afforestation areas in the eight southwestern provinces could still fix 2.39 Pg C yr.−1 in the future, while old forests and new forest areas had carbon sequestration potential of 0.86 Pg C yr.−1 and 0.99 Pg C yr.−1, respectively, reaching an overall carbon sequestration potential of 87%. Especially for the old forest, it had reached 88.8% of its CSCC (Zhang et al., 2022b). Our results showed that the CSCC in China was 4.13 Pg C yr.−1, while the current (2018) total NPP was 3.26 Pg C yr.−1, which had reached 78.74% of the CSCC. In the future, the carbon sink that can be increased is 0.88 Pg C yr.−1, with a increase proportion of 21.26%. The CSCC of southern China (eight provinces) was 1.38 Pg C yr.−1, and had reached 1.1 Pg C yr.−1 in 2018, accounting for 80% of CSCC. In the future, it is estimated that a maximum of 0.28 Pg C yr.−1 of carbon sequestration can be increased annually in southern China. So far, southern China had become the region with the highest carbon sink increase in China, reaching 163.19 g C m−2 yr.−1, which was 37.3% higher than the average potential of China (123.23 g C m−2 yr.−1). it was also found that the CSCC simulated based on previous models was much higher than the CSCC obtained based on the maximum synthesis method in this study. The main reason was that the Miami model was based on the simulation of the relationship between plant growth status and biomass around the world, annual average temperature, and annual precipitation. However, the changes in CSCC were often influenced by a combination of many factors, and the limiting factors might be ignored in the simulation process, and this result had not been truly achieved in previous years.
5.2. Impact of climate change and ecological engineering on CSCC and CSR
NPP in the VCA of China had shown an overall increasing trend from 1981 to 2018, accounting for 81.44% of the total area. This phenomenon was mainly driven by climate change and ecological engineering. According to previous reports, the CSCC in north China, northwest China and SC basin was mainly affected by precipitation, and that in the Qinhai-Tibet Plateau and the eastern the YN-GZ Plateau was mainly affected by temperature (Wu et al., 2020; Tu et al., 2023). The area with a positive correlation between NPP and temperature accounted for 73.25% of VCA in China, mainly distributed in the northwest, southwest, and south of China (Zhao et al., 2020), as well as in the northern part of east China, the eastern part of north China, and the southern part of northeast China. From 2000 to 2017, the region where NPP was positively related to precipitation accounted for 70.36% of VCA in China. It was mainly distributed in the central part of northeast China, north China, central China, and northwest China, as well as the SC basin, the western part of south China and the northern part of east China.
This study had further detected that the Loess Plateau and North China Plain were the regions with the fastest growth of vegetation carbon sink in China. The growth of NPP in the Loess Plateau was attributed to the increase in temperature and precipitation in northern China, which had improved the hydrothermal conditions in arid and semi-arid regions. In addition, it was also thanks to China’s strong promotion of afforestation projects, which not only contributed greatly to the Loess Plateau, but also to the entire China. Other studies had shown that China had increased the forest and grassland areas by returning farmland to forests, greatly consolidating the growth of vegetation carbon sinks (Chen et al., 2019). The growth trend of NPP in China (22.4–24.9 Tg C yr.−1) was highly correlated with human activities (71–81%), especially in the southern, eastern, and northeastern regions of China during 2001–2018. The NPP losses caused by climate conditions (such as reduced radiation and precipitation) during the period 2001–2010 offset the carbon sequestration benefits of vegetation generated by ecological restoration. However, after 2010, due to the improvement of radiation and precipitation conditions in the central southern eastern and southwestern regions, both GPP and NPP on land in China experienced accelerated growth (Chen et al., 2021). In the karst area of south China, although the reduction of solar radiation had reduced the carbon sink in some regions, the reduction of carbon sink had also been effectively offset by the positive impact of human activities, and the total regional carbon sink was still growing (Wu et al., 2020). However, the negative effects of climate change had also been reported in multiple regions around the world. Climate risk led to uncertainty in the potential for global forest carbon storage (Wu et al., 2023), while the instability of terrestrial carbon sinks caused by extreme climate change might endanger future carbon sequestration (Ruehr et al., 2023). Extreme climate controlled immediate changes in photosynthesis and respiration rates through the environment, as well as legacy effects on carbon sequestration, which might further alter the physiological processes, structure, and composition of ecosystems, thereby affecting carbon balance. Research had shown that regions experiencing an increasing trend in climate variability also exhibited an increased variability in their NBP (Net biome productivity), which might indicate that instability in terrestrial net carbon absorption was occurring. There was a risk of instability in land carbon sinks in eastern Africa, the Mediterranean region, the western coasts of North and Central America, India, and Southeast Asia due to the impact of climate change (Fernández-Martínez et al., 2023). More and more evidence suggested that extreme climate events such as droughts or storms could lead to a decrease in carbon storage in regional ecosystems, potentially offsetting the expected increase in carbon absorption in terrestrial ecosystems (Reichstein et al., 2013). In the Qinghai Tibet Plateau, it was found that extreme drought events in the early and middle stages of the growth season resulted in an average decrease of 48 and 26% in the net CO2 absorption rate of the plateau peatland ecosystem after experiencing 5 consecutive years of extreme drought events. In addition, it was demonstrated that the intensity (occurrence, duration, and severity) of drought heat wave composite event in 70% of the global land areas would increase fourfold under medium and high emission scenarios based on the use of a collection of 111 large-scale climate hydrological models, while the frequency of extreme drought heat wave composite event (50 year historical event) would increase tenfold under the highest emission scenario and it would have a disproportionate impact on vegetation and socio-economic productivity in the late 21st century (Yin et al., 2023). On a global scale, simulations using the Terrestrial Biosphere Models (TBM) showed a decrease of 18.5 ± 9.3 g C m−2 yr.−1 in NPP during extreme heat, but an increase of 7 ± 4.6 g C m−2 yr.−1 in heterotrophic respiration (Rh). During extreme drought events, NPP and Rh decreased by 60.9 ± 24.4 g C m−2 yr.−1 and 16.5 ± 11.4 g C m−2 yr.−1, respectively. At the regional and global scales, drought was considered one of the main stress factors affecting the carbon sink function of current terrestrial ecosystems (Piao et al., 2019). Drought significantly weakens the carbon sink function of ecosystems and even turns them into carbon sources. Restrictions on water resources may play a more important role in limiting terrestrial carbon sinks than extreme temperatures. In 2003, the summer drought in Europe caused its ecosystem to release 0.5 Pg C into the atmosphere, offsetting the total carbon sequestration in the previous 4 years (Ciais et al., 2005). On a global scale, drought caused a net decrease of 0.19 Pg C in ecosystem carbon storage annually, accounting for 8.3% of the total carbon sink of global terrestrial ecosystems (Zscheischler et al., 2014). The carbon sequestration accumulated over the years in ecosystems may be disrupted by a severe long-term drought, and severe long-term drought should be explicitly considered in future regional or global carbon budget studies (Xiao et al., 2009).
Under the effect of human ecological engineering, NPP in the Loess Plateau was growing very rapidly, and it was almost reaching the limit that soil water could support (400 ± 5 g C m−2 yr.−1) calculated according to the current vegetation restoration and human water demand (Feng et al., 2016). In the future, it may increase by 36% to 544 ± 5 g C m−2 yr.−1 under the optimal conditions of climate change and human activities. It was worth noting that land use patterns also showed a significant impact on the interannual changes of carbon sinks in China’s terrestrial ecosystem (Zhao et al., 2019, 2022, 2023a,b; Liu et al., 2023). The increase of carbon sink in most provinces of the north China Plain was mainly due to large-scale farmland planting. Judging from the spatial distribution characteristics of the country, the CSCC of farmland areas was also extremely high, only inferior to forest ecosystems. The highest growth rate of NPP in terrestrial ecosystems of China and various regions from 2000 to 2017 was in farmland ecosystems (4.84 g C m−2 yr.−1), which was 57.14% higher than forest ecosystems (3.08 g C m−2 yr.−1). More than 80% of the NPP growth of farmland in the north China Plain was caused by human activities (Tu et al., 2023). This was because China had long issued national agricultural policies, strengthened the construction of high standard farmland, developed modern facility agriculture, and made every effort to focus on food production. It had also established a diversified food supply system, promoting large-scale and high standard cultivation of farmland, leading to rapid growth of carbon sequestration in farmland. Despite the rapid growth of NPP in these regions, the total amount of NPP was gradually approaching the limit of carbon carrying capacity, and the carbon sequestration capacity may soon become saturated, which might lead to a series of other ecological problems, such as increased water resource consumption due to carbon sequestration, and soil nutrient shortage caused by carbon fixation (Wieder et al., 2015; Terrer et al., 2019; Du et al., 2020; Hou et al., 2020). The carbon sink growth generated by farmland cultivation was not a stable vegetation carbon sink. Due to the fact that most crops in farmland were annual plants and the strong impact of artificial interference and fertilization, it might be converted into carbon sources in a short time scale, thus unable to form long-term stable carbon sinks. However, the decrease in NPP in the southeastern coastal areas of China was mainly due to urban expansion encroaching on farmland or forests and grasslands (Wu et al., 2014; Liu et al., 2019; Zhang et al., 2022b; Tu et al., 2023), which was also the reason for the relatively weak CSR of the ecosystems in the southeastern coastal provinces.
In addition, the temporal differences in the CSCC of ecosystems in different regions of China were related to the ecological protection plans implemented (Lu et al., 2018; Zheng et al., 2019; Shi et al., 2020; Wu et al., 2020). As shown in Figure 3C, the carbon sink in most regions of south China karst province had peaked after 2000, the NPP potential in the Loess Plateau region had peaked after 2015, and urban areas had peaked before 1990. Launched in the late 1970s, the implementation area of the Three-North Shelterbelt Program, known as the “Green Great Wall,” had exceeded half of northern China. The program directly led to the largest carbon sink peak in southern XJ, northern IM, and northwest China between 1980 and 1990. Nearly half of QH, TB, XJ, and other provinces had reached carbon sink potential before 1990. However, the Yangtze River and the Pearl River Shelter Forest Project launched in southern China in 1989 had made the carbon sink capacity of GD, GX, and some regions in the middle and upper reaches of the Yangtze River reach its CSCC after 1990 (Zhang et al., 2022b). The “Natural Forest Protection Project” launched in 1998 covering the upper reaches of the Yangtze River, the upper and middle reaches of the Yellow River, and key state-owned forest areas such as northeast China and IM, as well as the world’s largest ecological restoration project of returning farmland to forests/grasslands launched in 2000, had made significant contributions to promoting the peak carbon sequestration in the southern karst areas and northeast natural forest areas in 2000. The Beijing-Tianjin Sand Source Control Project launched in 2001 to control the risks of sandstorms and soil erosion disasters, as well as the “Returning return grazing land to grassland” project launched in 2003 to reduce the impact of overgrazing, had significantly improved the productivity of forests and grasslands in northern provinces, resulting in large-scale peak carbon sinks in ecosystems in regions such as HB, BJ, and TJ after 2000 (Lu et al., 2018; Zhang M. et al., 2022). In the Loess Plateau region, vegetation had been rapidly restored due to the continuous increase in ecological protection and the warming and humidifying of the climate, leading to a significant increase in ecosystem carbon sequestration. Most regions experienced a peak in carbon sink around 2015, and some regions might even reach higher peaks in the future as the climate improved (Feng et al., 2016).
5.3. Limitations and future research
Due to the differences in climate conditions and vegetation growth characteristics among different years, it is difficult to accurately obtain the CSCC of ecosystems through model simulation. The CSCC of the ecosystem in this study is characterized by the interannual optimal value of NPP between 1981 and 2018 as its maximum limit value. The study characterizes the potential improvement of current and future surface carbon sequestration capacity through the difference between CSCC and the actual NPP value in 2018. The advantage of this method is that the maximum limit value on each pixel is a value that has already been reached, which is real and has not been reached again due to various limitations or negative effects in the later stage. However, the spatial distribution of vegetation and the length of research years may directly affect the final calculated potential level of carbon sequestration capacity improvement, and it cannot guarantee whether higher values will occur in the future. The nonlinear and linear fitting results of the global carbon sequestration potential of forest aboveground biomass show that the maximum carbon carrying capacity of the current vegetation aboveground biomass in the southwest region is approximately around 2030–2060. Afforestation and sustainable forest land management in eight provinces and regions in southwest China provide an important window period for achieving the goal of carbon neutrality, which is an important potential area for ecological carbon sink enhancement in China (Zhang M. et al., 2022). In the future, we will further accurately evaluate the CSCC of ecosystems, clarify the potential space and key driving mechanisms for carbon sink increasing in each region. In order to achieve this goal, it is urgent to carry out precise quantitative research on ecological restoration carbon sink function based on high-resolution satellite remote sensing and deep learning in the future. It is worth noting that the increasingly frequent extreme events, such as drought, and heat wave, rainstorm, heavy rainfall and extreme frost, have significantly negative impacts on carbon sink by influencing hydrothermal process, reducing terrestrial carbon sink to varying degrees, and even transforming carbon sink into carbon source (Pan et al., 2020). Future research on the resilience of ecosystem carbon sinks should focus on the impact of extreme climate events, the differentiation characteristics and response sensitivity of ecosystem carbon sink resilience on short and long time scales.
In addition, due to the fact that only regional results can be fitted when calculating the resilience of vegetation carbon sinks, the assessment of ecosystem CSR is only a comprehensive result of a recovery period at the provincial and national levels, and cannot be effectively evaluated at the pixel scale to assess the current status of spatial resilience, nor can possible influencing factors of CSR be quantitatively explored. Therefore, more scientific and effective methods will be proposed in the future to quantitatively evaluate the CSR of ecosystems at the spatial pixel scale, and to systematically elucidate the driving mechanism of the impact of CSR in ecosystems.
6. Conclusion
In this study, the CSCC and increase proportion of China were quantitatively evaluated based on the maximum synthesis method, and the CSR intensity of various provinces in China was further quantified using the probability attenuation method. The conclusions are as follows:
1. The NPP of VCA showed an increasing trend from 1981 to 2018, with an average growth rate of 1.66 g C m−2 yr.−1, and the growth area accounted for 81.44% of VCA in China. The total net increase of NPP was 0.32 P g C, with an increase of 15.55% over the past 38 years.
2. The average CSCC in China was 658.59 g C m−2 yr.−1, with a total amount of 4.13 Pg C yr.−1. The NPP exceeded 60% of CSCC in various years. The total NPP in 2018 was 3.26 Pg C yr.−1 and had reached 78.74% of CSCC. In the future, the vegetation carbon sink that can be increased was 0.88 Pg C yr.−1, which was 21.26% higher than the current level.
3. From 2000 to 2018, the NPP of VCA in China generally maintains a positive change trend, with a decay time of 196 years for maintaining a positive trend and 7 years for maintaining a negative trend. Only four provinces (HUN, CQ, AH, and JS) in China have showed the extremely strong levels of ecosystem CSR, reaching 1,139, 2,207, 2,008, and 789 years, respectively.
Data availability statement
Publicly available datasets were analyzed in this study. This data can be found here: http://www.geodata.cn.
Author contributions
LW: Conceptualization, Data curation, Writing – original draft, Writing – review & editing. YZ: Formal analysis, Methodology, Writing – original draft. GL: Investigation, Data curation, Software, Writing – original draft. DC: Data curation, Software, Methodology, Writing – original draft. DY: Data curation, Software, and Writing – original draft. YY: Investigation, Formal analysis, Data curation, Writing – original draft. FT: Writing – original draft, Software.
Funding
The author(s) declare financial support was received for the research, authorship, and/or publication of this article. This research work was supported jointly by the Guizhou Provincial Science and Technology Projects (No. ZK[2023]-464, No. ZK[2023]-465); Scientific Research Projects in Higher Education Institutions of Guizhou Provincial Department of Education (Youth Project) (No. 2022-351, No. KY[2020]164); Science and Technology Projects of Tongren City (No. 2023-5, No. 2023-38, No. 2022-63); National Natural Science Foundation of China (No. 42261052); Guizhou Provincial Party Committee Program on Deepen Reform Survey (No. GZGGKT2022-127); Tongren Municipal Party Committee Major Policy Decisions Research Program (No. 20220012); Doctoral Research Startup Fund Project of Tongren University (No. trxyDH2103); Guizhou Provincial Major Science and Technology Achievement Transformation Project (No. 2022-010).
Acknowledgments
We would like to thank all the authors for their great guidance and help in writing this manuscript. In addition, acknowledgement for the data support from “National Earth System Science Data Center, National Science and Technology Infrastructure of China (http://www.geodata.cn)”.
Conflict of interest
The authors declare that the research was conducted in the absence of any commercial or financial relationships that can be construed as a potential conflict of interest.
Publisher’s note
All claims expressed in this article are solely those of the authors and do not necessarily represent those of their affiliated organizations, or those of the publisher, the editors and the reviewers. Any product that may be evaluated in this article, or claim that may be made by its manufacturer, is not guaranteed or endorsed by the publisher.
Footnotes
References
Ben, B. L., Bailey, V. L., Min, C., Gough, C. M., and Rodrigo, V. (2018). Globally rising soil heterotrophic respiration over recent decades. Nature 560, 80–83. doi: 10.1038/s41586-018-0358-x
Benítez, P. C., McCallum, I., Obersteiner, M., and Yamagata, Y. (2007). Global potential for carbon sequestration: geographical distribution, country risk and policy implications. Ecol. Econ. 60, 572–583. doi: 10.1016/j.ecolecon.2005.12.015
Bi, F., and Pan, J. H. (2022). Estimation of tempora and spafial distribution of potential vegetation net primary productivity in China since 2000. Acta Eeol. Sin. 42, 10288–10296. doi: 10.5846/stxb202111053112
Cai, W. X., He, N. P., Li, M. X., Xu, L., Wang, L. Z., Zhu, J. H., et al. (2021). Carbon sequestration of Chinese forests from 2010–2060: Spatio-temporal dynamics and its regulatory strategies. Sci. Bull. 67, 836–843. doi: 10.1016/j.scib.2021.12.012
Chen, J. D., Fan, W., Li, D., Liu, X., and Song, M. L. (2020). Driving factors of global carbon footprint pressure: based on vegetation carbon sequestration. Appl. Energ 267:114914. doi: 10.1016/j.apenergy.2020.114914
Chen, Y., Feng, X., Tian, H., Wu, X., Gao, Z., Feng, Y., et al. (2021). Accelerated increase invegetation carbon sequestration in China after 2010: a turningpoint resulting from climate and human interaction. Glob. Chang. Biol. 27, 5848–5864. doi: 10.1111/gcb.15854
Chen, C., Park, T., Wang, X., Piao, S., Xu, B., Chaturvedi, R. K., et al. (2019). China and India lead in greening of the world through land-use management. Nat. Sustain. 2, 122–129. doi: 10.1038/s41893-019-0220-7
Ciais, P., Reichstein, M., Viovy, N., Granier, A., Ogée, J., Allard, V., et al. (2005). Europe-wide reduction in primary productivity caused by the heat and drought in 2003. Nature 437, 529–533. doi: 10.1038/nature03972
Cook-Patton, S. C., Leavitt, S. M., Gibbs, D., Harris, N. L., Lister, K., Anderson-Teixeira, K. J., et al. (2020). Mapping carbon accumulation potential from global natural forest regrowth. Nature 585, 545–550. doi: 10.1038/s41586-020-2686-x
Cui, T. X., Wang, Y. J., Sun, R., Qiao, C., Fan, W., Jiang, G., et al. (2016). Estimating vegetation primary production in the Heihe River basin of China with multi-source and multi-scale data. PLoS One 11:e0153971. doi: 10.1371/journal.pone.0153971
Doelman, J. C., Stehfest, E., Vuuren, D. P., Tabeau, A., Hof, A. F., Braakhekke, M. C., et al. (2020). Afforestation for climate change mitigation: potentials, risks and trade-offs. Glob. Chang. Biol. 26, 1576–1591. doi: 10.1111/gcb.14887
Domke, G. M., Oswalt, S. N., Walters, B. F., and Morin, R. S. (2020). Tree planting has the potential to increase carbon sequestration capacity of forests in the United States. Proc. Natl. Acad. Sci. 117, 24649–24651. doi: 10.1073/pnas.2010840117
Du, E., Terrer, C., Pellegrini, A., Ahlstrm, A., Lissa, C., Zhao, X., et al. (2020). Global patterns of terrestrial nitrogen and phosphorus limitation. Nat. Geosci. 13, 221–226. doi: 10.1038/s41561-019-0530-4
Erbaugh, J. T., Pradhan, N., Adams, J., Oldekop, J. A., Agrawal, A., Brockington, D., et al. (2020). Global forest restoration and the importance of prioritizing local communities. Nat. Ecol. Evol 4, 1472–1476. doi: 10.1038/s41559-020-01282-2
Fang, J., Yu, G., Liu, L., Hu, S., and Chapin, F. S. (2018). Climate change, human impacts, and carbon sequestration in China. Proc. Natl. Acad. Sci. 115, 4015–4020. doi: 10.1073/pnas.1700304115
Feng, X., Fu, B., Piao, S., Wang, S., Ciais, P., Zeng, Z., et al. (2016). Revegetation in china's loess plateau is approaching sustainable water resource limits. Nat. Clim. Chang. 6:1019. doi: 10.1038/nclimate3092
Fernández-Martínez, M., Peñuelas, J., Chevallier, F., Ciais, P., Obersteiner, M., Rödenbeck, C., et al. (2023). Diagnosing destabilization risk in global land carbon sinks. Nature 615, 848–853. doi: 10.1038/s41586-023-05725-1
Gahlot, S., Shu, S., Jain, A. K., and Roy, S. B. (2017). Estimating trends and variation of net biome productivity in India for 1980–2012 using a land surface model. Geophys. Res. Lett. 44, 11573–11579. doi: 10.1002/2017GL075777
Hasenauer, H., Petritsch, R., Zhao, M., Boisvenue, C., and Running, S. W. (2012). Reconciling satellite with ground data to estimate forest productivity at national scales. For. Ecol. Manag. 276, 196–208. doi: 10.1016/j.foreco.2012.03.022
He, N. P., Wen, D., Zhu, J. X., Tang, X. L., Xu, L., Zhang, L., et al. (2017). Vegetation carbon sequestration in Chinese forests from 2010 to 2050. Glob. Chang. Biol. 23, 1575–1584. doi: 10.1111/gcb.13479
Hou, E., Luo, Y., Kuang, Y., Chen, C., and Wen, D. (2020). Global meta-analysis shows pervasive phosphorus limitation of aboveground plant production in natural terrestrial ecosystems. Nat. Commun. 11:637. doi: 10.1038/s41467-020-14492-w
Huang, Y., Sun, W., Qin, Z., Zhang, W., Yu, Y., Li, T., et al. (2022). The role of China's terrestrial carbon sequestration 2010-2060 in offsetting energy-related CO2 emissions. Natl. Sci. Rev. 9:nwac057-nwac057. doi: 10.1093/nsr/nwac057
Jiang, F., Chen, J. M., Zhou, L. X., Ju, W. M., Zhang, H. F., Machida, T., et al. (2016). A comprehensive estimate of recent carbon sinks in China using both top-down and bottom-up approaches. Sci. Rep. 2016:22130. doi: 10.1038/srep22130
Li, D. K., and Wang, Z. (2018). The characteristics of NPP of terrestrial vegetation in China based on MOD17A3 data. Ecol. Environ. Sci. 27, 397–405. doi: 10.16258/j.cnki.1674-5906.2018.03.001
Liu, X., Pei, F., Wen, Y., Li, X., and Liu, Z. (2019). Global urban expansion offsets climate-driven increases in terrestrial net primary productivity. Nat. Commun. 10, 18866–18836. doi: 10.1038/s41467-019-13462-1
Liu, J. X., Wang, Z., Duan, Y. F., Li, X. R., Zhang, M. Y., Liu, H. Y., et al. (2023). Effects of land use patterns on the interannual variations of carbon sinks of terrestrial ecosystems in China. Ecol. lndic. 146:109914. doi: 10.1016/j.ecolind.2023.109914
Liu, Y. C., Yu, G. R., Wang, Q. F., Zhang, Y. J., and Xu, Z. H. (2014). Carbon carry capacity and carbon sequestration potential in China based on an integrated analysis of mature forest biomass. Sci. China Life Sci. 57, 1218–1229. doi: 10.1007/s11427-014-4776-1
Lu, F., Hu, H. F., Sun, W. J., Zhu, J. J., Liu, G. B., Zhou, W. M., et al. (2018). Effects of national ecological restoration projects on carbon sequestration in China from 2001 to 2010. Proc. Natl. Acad. Sci. 115, 4039–4044. doi: 10.1073/pnas.170029411
Pan, Y., Birdsey, R. A., Fang, J., Houghton, R., Kauppi, P. E., and Kurz, W. A. (2011). A large and persistent carbon sink in the world’s forests. Science 333, 988–993. doi: 10.1126/science.1201609
Pan, J., and Xu, B. (2020). Spatial distribution simulation of potential vegetation NPP in China. J. Ecol. 39, 1001–1012. doi: 10.13292/j.1000-4890.202003.030
Pan, S., Yang, J., Tian, H., Shi, H., Chang, J., Ciais, P., et al. (2020). Climate extreme versus carbon extreme: responses of terrestrial carbon fluxes to temperature and precipitation. J. Geophys. Res. Biogeosci. 125:e2019JG005252. doi: 10.1029/2019JG005252
Piao, S., He, Y., Wang, X., and Chen, F. (2022). Estimation of China’s terrestrial ecosystem carbon sink: methods, progress and prospects. Sci. China Earth Sci 65, 641–651. doi: 10.1007/s11430-021-9892-6
Piao, S., Zhang, X., Chen, A., Liu, Q., Lian, X., Wang, X., et al. (2019). The impacts of climate extremes on the terrestrial carbon cycle: A review. Sci. China Earth Sci., 62, 1551–1563. doi: 10.1007/s11430-018-9363-5
Reichstein, M., Bahn, M., Ciais, P., Frank, D., Mahecha, M. D., Seneviratne, S. I., et al. (2013). Climate extremes and the carbon cycle. Nature 500, 287–295. doi: 10.1038/nature12350
Ren, Z., Zhu, H., Shi, H., and Liu, X. (2017). Changes in the spatial and temporal distribution pattern of potential natural vegetation NPP in China and its response to climate and topography. Grassl. J. 25, 474–485. doi: 10.3390/rs14071634
Ruehr, S., Keenan, T. F., Williams, C., Zhou, Y., Lu, X. C., and Bastos, A. (2023). Evidence and attribution of the enhanced land carbon sink. Nat. Rev. Earth Env. 4, 518–534. doi: 10.1038/s43017-023-00456-3
Shi, W. Y., Chen, Y. Z., and Feng, X. M. (2020). Identifying the terrestrial carbon benefits from ecosystem restoration in ecologically fragile regions. Agric. Ecosyst. Environ. 296:106889. doi: 10.1016/j.agee.2020.106889
Tang, C. P., Beckae, B., Smith, B., and Miller, P. A. (2010). Estimating potential forest NPP, biomass and their climatic sensitivity in New England using adynami C ecosystem model. Ecosphere 1, 1–20. doi: 10.1890/ES10-00087.1
Terrer, C., Jackson, R. B., Prentice, I. C., Keenan, T. F., and Franklin, O. (2019). Nitrogen and phosphorus constrain the CO2 fertilization of global plant biomass. Nat. Clim. Chang. 9:684. doi: 10.1038/s41558-019-0545-2
Tong, X., Brandt, M., Yue, Y., Ciais, P., Jepsen, M. R., Penuelas, J., et al. (2020). Forest management in southern China generates short term extensive carbon sequestration. Nat. Commun. 11:129. doi: 10.1038/s41467-019-13798-8
Tong, X. W., Brandt, M., Yue, Y. M., Horion, S., Wang, K. L., and Keersmaecker, W. D. (2018). Increased vegetation growth and carbon stock in China karst via ecological engineering. Nat. Sustain. 1, 44–50. doi: 10.1038/s41893-017-0004-x
Tu, H. Y., Jiapaer, C., Yu, T., Li, X., and Chen, B. J. (2023). Analysis of spatio-emporal variation characteristics and influencing factos of net primary productivity in terrestrial ecosystems of China. Acta Ecol. Sin. 43, 1219–1233. doi: 10.3390/rs15112871
Wan, H., Li, H., Gao, J., Sun, C., Li, G., Gao, Y., et al. (2022). Analysis of the spatial pattern of the potential to improve the carbon sequestration capacity of China's vegetation ecosystem. J. Ecol. 42, 8568–8580. doi: 10.5846/stxb202107171928
Wang, J., Feng, L., Palmer, P. I., Liu, Y., Fang, S., Bösch, H., et al. (2020). Large Chinese land carbon sink estimated from atmospheric carbon dioxide data. Nature 586, 720–723. doi: 10.1038/s41586-020-2849-9
Wang, M. J., Sun, R., Zhu, A. R., and Xiao, Z. Q. (2020). Evaluation and comparison of light use efficiency and gross primary productivity using three different approaches. Remote Sens. (Basel) 12:1003. doi: 10.3390/rs12061003
Wieder, W. R., Cleveland, C. C., Smith, W. K., and Todd-Brown, K. (2015). Future productivity and carbon storage limited by terrestrial nutrient availability. Nat. Geosci. 8, 441–444. doi: 10.1038/ngeo2413
Wu, C., Coffield, S. R., Goulden, M. L., Randerson, J. T., Trugman, A. T., and Anderegg, W. R. L. (2023). Uncertainty in US forest carbon storage potential due to climate risks. Nat. Geosci. 16, 422–429. doi: 10.1038/s41561-023-01166-7
Wu, L., Wang, S., Bai, X., Tian, Y., Luo, G., Wang, J., et al. (2020). Climate change weakens the positive effect of human activities on karst vegetation productivity restoration in southern China. Ecol. Indic. 2020:106392. doi: 10.1016/j.ecolind.2020.106392
Wu, S., Zhou, S., Chen, D., Wei, Z., Dai, L., and Li, X. (2014). Determining the contributions of urbanisation and climate change to NPP variations over the last decade in the yangtze river delta, China. Sci. Total Environ. 472, 397–406. doi: 10.1016/j.scitotenv.2013.10.128
Xiao, J. F., Zhuang, Q. L., Liang, E. Y., Mcguire, A. D., Moody, A., Kicklighter, D. W., et al. (2009). Twentieth-century droughts and their impacts on terrestrial carbon cycling in China. Earth Interact. 13, 1–31. doi: 10.1175/2009EI275.1
Yang, Y. H., Shi, Y., Sun, W. J., Chang, J., Zhu, J., Chen, L., et al. (2022). Terrestrial carbon sinks in China and around the world and their contribution to carbon neutrality. Sci. China Life Sci. 65, 861–895. doi: 10.1007/s11427-021-2045-5
Yin, J., Gentine, P., Slater, L., Gu, L., Pokhrel, Y., Hanasaki, N., et al. (2023). Future socio-ecosystem productivity threatened by compound drought-heatwave events. Nat. Sustain. 6, 259–272. doi: 10.1038/s41893-022-01024-1
Yu, T., Sun, R., Xiao, Z. Q., Zhang, Q., Liu, G., Cui, T. X., et al. (2018). Estimation of global vegetation productivity from global land surface satellite data. Remote Sens. (Basel) 10:327. doi: 10.3390/rs10020327
Yu, G. R., Zhu, J. X., Xu, L., and He, N. P. (2022). Technological approaches to enhance ecosystem carbon sink in China: nature-based solutions. Bull. Chin. Acad. Sci. 37, 490–501. doi: 10.16418/j.issn.1000-3045.20220121002, (in Chinese)
Zhang, S. R., Bai, X. Y., Zhao, C. W., Tan, Q., Luo, G. J., Cao, Y., et al. (2021). Limitations of soil moisture and formation rate on vegetation growth in karst areas. Sci. Total Environ. 2021:151209. doi: 10.1016/j.scitotenv.2021.151209
Zhang, X. M., Brandt, M., Yue, Y. M., Tong, X. W., Wang, K. L., and Fensholt, R. (2022a). The carbon sink potential of southern China after two decades of afforestation. Earth's Future 10:e2022EF002674. doi: 10.1029/2022EF002674
Zhang, M., Jiang, W., Chen, Q., and Liu, X. (2014). Simulation of China's grassland net primary productivity based on CSCS improved CASA model. Chinese Desert 34, 1150–1160. doi: 10.12118/j.issn.1000–6060.2021.02.08
Zhang, X. M., Yue, Y. M., Tong, X. W., Wang, K. L., Qi, X. K., Deng, C. Q., et al. (2022b). Eco-engineering controls vegetation trends in Southwest China karst. Sci. Total Environ. 770:145160. doi: 10.1016/j.scitotenv.2021.145160
Zhang, M., Zhang, L., He, H., Ren, X., Lv, Y., Niu, Z., et al. (2022). Improvement of ecosystem quality in National key Ecological Function Zones in China during 2000-2015. J. Environ. Manag. 324:116406. doi: 10.1016/j.jenvman.2022.116406
Zhao, S., Pereira, P., Wu, X. Q., Zhou, J. X., Cao, J. H., and Zhang, W. X. (2020). Global karst vegetation regime and its response to climate change and human activities. Ecol. Indic. 113:106208. doi: 10.1016/j.ecolind.2020.106208
Zhao, M., and Running, S. W. (2010). Drought-induced reduction in global terrestrial net primary production from 2000 through 2009. Science 329, 940–943. doi: 10.1126/science.1192666
Zhao, F., Wang, X., Wu, Y., and Kumar, S. (2023a). Prefectures vulnerable to water scarcity are not evenly distributed across China. Commun. Earth Environ. 4:145. doi: 10.1038/s43247-023-00808-3
Zhao, F., Wang, X., Wu, Y., Sivakumar, B., and Liu, S. (2023b). Enhanced dependence of China's vegetation activity on soil moisture under drier climate conditions. J. Geophys. Res. Biogeo. 128:e2022JG007300. doi: 10.1029/2022JG007300
Zhao, F., Wu, Y., Sivakumar, B., Long, A., Qiu, L., Chen, J., et al. (2019). Climatic and hydrologic controls on net primary production in a semiarid loess watershed. J. Hydrol. 568, 803–815. doi: 10.1016/j.jhydrol.2018.11.031
Zhao, F., Wu, Y., Yin, X., Alexandrov, G., and Qiu, L. (2022). Toward sustainable revegetation in the loess plateau using coupled water and carbon management. Eng. PRC 15, 143–153. doi: 10.1016/j.eng.2020.12.017
Zheng, H., Lin, H., Zhou, W., Bao, H., Zhu, X., Jin, Z., et al. (2019). Revegetation has increased ecosystem water-use efficiency during 2000-2014 in the Chinese loess plateau: evidence from satellite data. Ecol. Indic. 102, 507–518. doi: 10.1016/j.ecolind.2019.02.049
Keywords: karst, NPP, carbon sink carrying capacity, restoration potential, China
Citation: Wu L, Zhang Y, Luo G, Chen D, Yang D, Yang Y and Tian F (2023) Characteristics of vegetation carbon sink carrying capacity and restoration potential of China in recent 40 years. Front. For. Glob. Change. 6:1266688. doi: 10.3389/ffgc.2023.1266688
Edited by:
Vilém Pechanec, Palacký University Olomouc, CzechiaReviewed by:
Fubo Zhao, Xi'an Jiaotong University, ChinaHesong Wang, Beijing Forestry University, China
Copyright © 2023 Wu, Zhang, Luo, Chen, Yang, Yang and Tian. This is an open-access article distributed under the terms of the Creative Commons Attribution License (CC BY). The use, distribution or reproduction in other forums is permitted, provided the original author(s) and the copyright owner(s) are credited and that the original publication in this journal is cited, in accordance with accepted academic practice. No use, distribution or reproduction is permitted which does not comply with these terms.
*Correspondence: Luhua Wu, jgywlh@gztrc.edu.cn