Real area of contact and tractions on the patterned surfaces generated by spinodal decomposition and amplified instability
 Wonhyeok Lee
 Melih Eriten
- Department of Mechanical Engineering, University of Wisconsin-Madison, Madison, WI, United States
Past decades featured significant advancements in additive and micromanufacturing that facilitated the creation of functional patterned surfaces with impressive spatial resolutions. However, these techniques are expensive and require a considerable amount of time and energy, and hence lack scalability to practical surfaces. Recent techniques employing spinodal decomposition and instabilities amplified via centrifugal acceleration offer viable and cheaper alternatives. The patterns created by those techniques, however, vary randomly in geometry. When interfacing those patterned surfaces with other components and under self-contact scenarios, geometric variations lead to stress concentration and abrupt failure around the contact. In this study, we investigate numerically real contact areas, contact tractions, and stress concentration. We generate patterned surfaces in congruence with actual surfaces created by those techniques. Then, we conduct normal-contact analyses of those surfaces boundary element method (BEM) under nominal mean pressures ranging from 0.001E* to E*, where E* is the contact modulus. We record real contact areas and stress concentration as a function of nominal mean pressures. We compare these values with the analytical solutions from sinusoidally-patterned and randomly rough surfaces. Randomness in pattern geometry is primarily influenced by the processing parameters such as the degree of anisotropy in spinodal decomposition and acceleration in amplified instabilities. To understand the influence of the processing parameters, we perform a parametric study. We find isotropic spinodal decomposition creates patterns that deliver contact area and traction distributions similar to randomly rough surfaces, and lead to high-stress concentrations. Such high-stress concentrations are expected to occur under self-contact loading scenarios, and thus can explain the compromised resilience and strength in recently-proposed spinodal metamaterials. For patterned surfaces created by amplified instabilities, high-stress concentrations are obtained for the surfaces created at high accelerations. At high accelerations, increased elastic instabilities and stochastic growth result in a more skewed and broader distribution in heights. Therefore, high-stress concentrations are inevitable. To account for combined loading scenarios, we conduct additional simulations on the same surface patterns with frictional pre-sliding contacts. We find the frictional tractions play a secondary role in stress concentrations where the primary factor is the processing parameters determining the degree of randomness in pattern geometry.
1 Introduction
Surface patterning has found widespread use in tailoring contact properties such as wettability (Bico et al., 2001), adhesion (Davis and Crosby, 2011), stiffness (Perris et al., 2021), and friction (Eriten et al., 2016; Afshar-Mohajer and Zou, 2020). Conventional methods of surface patterning such as additive manufacturing (Askari et al., 2020), micro/nanofabrication (Dong et al., 2018; Wang et al., 2022), and ultra-precision machining (Yu et al., 2011) require a significant amount of resources, energy and time. Hence, alternative patterning techniques are currently sought for more sustainability, scalability, energy efficiency, and cost-effectiveness. Several examples of such methods include selective etching during spinodal decomposition (Hodge et al., 2007; Lee and Mohraz, 2010), amplified Rayleigh-Taylor instabilities during sol-gel transitions (Marthelot et al., 2018; Jambon-Puillet et al., 2021), pulsed laser patterning (Chen et al., 2020), patterns induced by plate buckling (Holmes et al., 2008; Davis and Crosby, 2011), and force-triggered patterns in mechano-responsive hydrogels (Matsuda et al., 2019; Mu et al., 2022). However, surface patterns obtained by these efficient and scalable techniques inherently have randomness in geometry, and geometric randomness deters their performance under contact loading. For instance, taller asperities with smaller curvatures co-exist with shorter and blunter asperities due to inherent randomness in the manufacturing process. This randomness is expected to lead to a reduction in the real area of contact and thus high-stress concentrations and failure in contact applications.
In this paper, we simulate the contact performance of surfaces created by two of those alternative surface patterning techniques, namely, spinodal decomposition and Rayleigh-Taylor instability methods, and study the influence of processing parameters on the real area of contact, contact tractions, and stress concentration factors. Surface patterns created by spinodal decomposition are the product of the decomposition of two phases interrupted at an arbitrary time and the removal of one of the phases selectively. Spinodal architectures are shown to facilitate multifunctionality and tunability in stiffness when used in 3D lattices, metamaterials, and cellular materials (Vidyasagar et al., 2018; Guell Izard et al., 2019; Hsieh et al., 2019; Kumar et al., 2020; Portela et al., 2020). As a clear advantage over conventional microstructures (e.g., discrete walls and beam struts), the spinodal topography reduces stress concentrations and promotes resilience in those metamaterials. However, the spinodal microstructures are prone to self-contact loading. For instance, unconfined compression tests on metamaterials with various spinodal topography (Portela et al., 2020) deliver nearly fully-recoverable strains under cyclic loading, and thus validate resilience. When examined carefully, however, self-contact among internal structures and failure around contacts are observed in several of those tests. Those internal failures clearly compromise the load-bearing capacity of those materials at subsequent loading cycles. Our study will reveal the performance of spinodal topographies under contact loading.
The other patterning technique we will study is the amplified Rayleigh-Taylor instability method. In this method, patterns are seeded as droplets in thin films of polymer blends, and centrifugal accelerations are adjusted by a rotating drum to amplify instabilities during the sol-gel transition and control heights and curvatures of hairs extending from initial droplets (Marthelot et al., 2018; Jambon-Puillet et al., 2021). In Ref. (Jambon-Puillet et al., 2021), the probability density functions (PDF) of the initial droplet heights and final hair heights formed at different rotating speeds are reported. The initial droplets form patterns with narrow height distribution; i.e., more uniform heights whereas the hair heights formed after additional rotations possess much broader distribution; i.e., random heights. This broadening in PDF of heights is expected to decrease the real area of contact and increase stress concentrations under contact loading.
Inspired by those observations, this paper investigates numerically the real area of contact, contact tractions, and stress concentration factors of patterned surfaces formed by spinodal decomposition and amplified instabilities. We first generate patterned surfaces in congruence with actual surfaces created by those processing techniques (Section 2.1). Then, we conduct normal and tangential-contact analyses of those surfaces via the boundary element method (Section 2.2 and Section 2.3). At each simulation, we record the real area of contact and stress concentration factor as a function of nominal mean pressures (Section 3). We then compare these values with the analytical solutions from the sinusoidally-patterned and randomly rough surfaces. Randomness in pattern geometry is primarily influenced by the processing parameters such as the degree of anisotropy in spinodal decomposition and acceleration in amplified instabilities. To understand the influence of the processing parameters and combined loading on contact tractions, we also present a parametric study (Section 4). To our best knowledge, systematic analysis of the performance of surfaces patterned by efficient and scalable manufacturing methods is currently missing in the literature.
2 Materials and methods
2.1 Generation of the surface geometry
First, we employ Numerical Python (NumPy) package to generate surface geometries consisting of the patterns created by two methods: i) spinodal decomposition and ii) amplified instabilities via material acceleration.
2.1.1 Spinodal decomposition
Surface patterns created by spinodal decomposition are the product of the decomposition of two phases interrupted at an arbitrary time and the selective discarding of one of the phases. The Cahn-Hilliard equation governs the spatiotemporal diffusion and evolution of phases, which can be quantified by the local concentration
While creating the surfaces via spinodal decomposition, the partial differential equation given in Eq. 1 should be numerically solved for
Obviously, the approximate series representation given in Eq. 2 provides the concentration ϕ(r) and thus surface heights much quicker than the full Cahn-Hilliard equation does. Besides, Kumar et al. (2020) showed that limiting the directions of the components ni would lead to anisotropic patterns, and thus the creation of various topographies is possible with a single expression. To generate the concentrations as a function of position, we first select the direction vector ni residing on the surface spanned by e1 and e2 basis vectors in x and y directions. Direction vector has a unit-norm and can be described by a single angle Θi = cos−1 (e1 ⋅ni) as ni = (cos Θi, sin Θi) in e1 and e2 basis. Thus, the selection of the direction vector is reduced to the choice of the angle Θ. If that angle is chosen randomly within the range [0, π/2], then the direction of wave components will be randomly distributed in the first quadrant defined by x > 0 ∧ y > 0 surface plane and the resultant surface patterns will be isotropic. Limiting the upper bound of that range to a particular angle θ, in contrast, will lead to strong directionality and thus anisotropy in the concentrations and surface patterns. After selecting the direction vector, phase angle Γi is randomly assigned from the range [0, 2π] to each wave. Summing the expressions for all waves as in Eq. 2 then yields the concentration ϕ(x, y) over the discretized surface plane. We then scale the concentrations uniformly to obtain a target of 0.1 [a.u.] for the root-mean-square (rms) of surface heights; i.e., h (x, y) = Cϕ(x, y) such that hrms = 0.1. The surface plane xy is 10 × 10 [a.u.] in dimension so that surface slopes
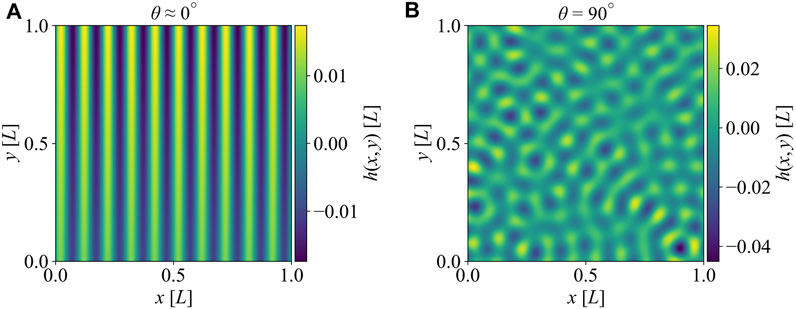
FIGURE 1. Surface heights h (x, y) generated by spinodal decomposition. (A) The surface with θ ≈ 0° (anisotropic surface). (B) The surface with θ = 90° (isotropic surface).
2.1.2 Amplified instability
Surfaces generated by amplified instability employ dynamics of a rotating drum to amplify instabilities and pattern formation in thin films of polymer blends such as polydimethylsiloxane (PDMS) and vinylpolysiloxane (VPS-8) (Jambon-Puillet et al., 2021). Here, we simulate this pattern formation by following the physical processes and corresponding equations reported in (Marthelot et al., 2018; Jambon-Puillet et al., 2021). In this process, one first coats a drum of radius R with a thin layer of polymer melt (PDMS + VPS-8) with surface tension γ and density ρ. Then, the drum is rotated at a slow speed Ω1 to induce Rayleigh-Taylor instabilities in the polymer melt and form an initial hexagonal array of “pendant droplets”. The wavelengths and heights of this initial pattern depend on the characteristic length
Solving Eq. 3 with properly selected boundary conditions delivers the axisymmetric initial droplet profile, z(s) and r(s). As in (Jambon-Puillet et al., 2021), we use the following boundary conditions: φ(0) = φ(sf) = −π/2, r (sf) = 0, z (0) = 0, and z (sf) = h0, where sf is the total arc length and h0 is the maximum height of the initial droplet. The first two of those boundary conditions relate to vanishing slopes of the profile at the edge (s = 0) and symmetry axis (s = sf) of the profile, and the last three follow from the coordinate definitions and instability-driven initial height, h0 at the axisymmetry axis. Setting h0 to a given value, one can use the shooting method to solve Eq. 3 and initially unknown total arc length sf, and obtain individual droplet profile as shown in Figure 2. Note that rf denotes a radial extent of the initial droplet. Marthelot et al. (2018) and Jambon-Puillet et al. (2021) show that theoretical solution to Eq. 3 captures well the profile of experimentally manufactured droplet by Rayleigh-Taylor instability. Because we assume the initial droplets are perfectly axisymmetric, we can simply render 3D shape of droplets h (x, y) in discretized xy plane for a single unit: there exists
Note that α is a measure of acceleration-induced pressure in terms of the elasticity of the partially-cured blend. Assuming lubrication theory, droplet shapes forming under the influence of gravity and surface tension were previously discussed in (Lister et al., 2010). In particular, the profile of an individual droplet at equilibrium can be expressed as Eq. 5, where J0 is the Bessel function of the first kind of order 0 and rf is the total radial length.
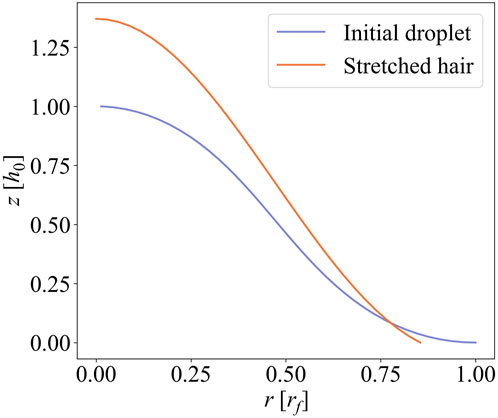
FIGURE 2. Representative profiles of the initial droplet and stretched hair. The initial droplet is given at Ω1 = 41.9 rad/s, and the stretched droplet is obtained at geff = 137 m/s2. h0 and rf denote the maximum heights and radial extent of the profiles of an initial droplet, respectively.
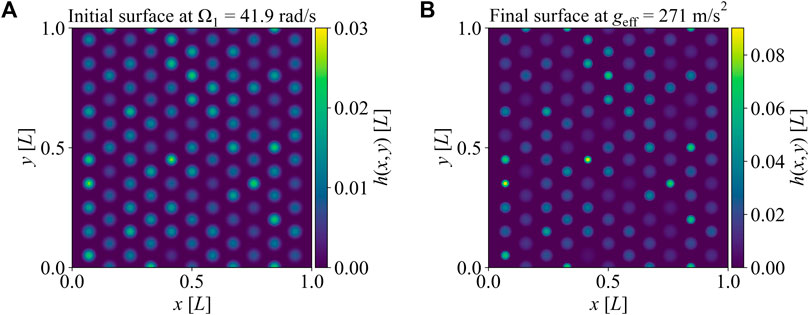
FIGURE 3. The images of the surface patterns generated by amplified instability. (A) The surface generated by Rayleigh-Taylor instability at the initial drum rotation speed of Ω1 = 41.9 rad/s. The surface has 115 droplets. (B) The surface generated by increasing the drum rotation speed further at geff = 271 m/s2.
2.2 Normal contact analysis
2.2.1 Numerical simulations
To simulate the elastic response of patterned surfaces under normal contact, we employ TAMAAS, an open-source C++-based Python Library developed by the Computational Solid Mechanics Laboratory at EPFL (Frérot et al., 2020). We simulate non-adhesive elastic contact and so utilize the conjugate gradient-based contact scheme (Polonsky and Keer, 1999) and boundary integral method. For that, as explained in the previous section, we first generate surfaces simulating the patterns created by the spinodal decomposition and amplified instability. Patterned surfaces are treated as rigid punches repeating periodically outside the xy domain to be pressed on elastic half-space. We assign 1 [a.u.] for Young’s modulus E and 0.5 for Poisson’s ratio ν of the elastic half-space. We then impose the nominal mean contact pressures p0 ranging from 0.001E* to E* and solve for the contact pressures at each grid point, p (x, y). All pressure units are normalized to the contact modulus E* = E/(1 − ν2).
Figure 4 shows representative contact pressure distributions obtained from the isotropic spinodal patterned surface and the initial surface generated by the amplified instability. Both surfaces are imposed to nominal mean contact pressures p0 of 3.16 × 10⁻²E*. One can see that only a minute portion of the nominal contact area is load-bearing and local contact pressures can attain very high values up to 2.5E* at the peaks of both surface patterns hinting at inevitable stress concentrations and potential failure. Both features are signatures of randomly rough surfaces. We will show in Section 3 that surface patterning via the two methods mentioned in the previous section can lead to a reduction in contact areas and stress concentrations comparable to randomly rough surfaces. To quantify the real area of contact Ar, we estimate the sum of grid areas with non-zero pressures, and obtain the real mean contact pressure pr as
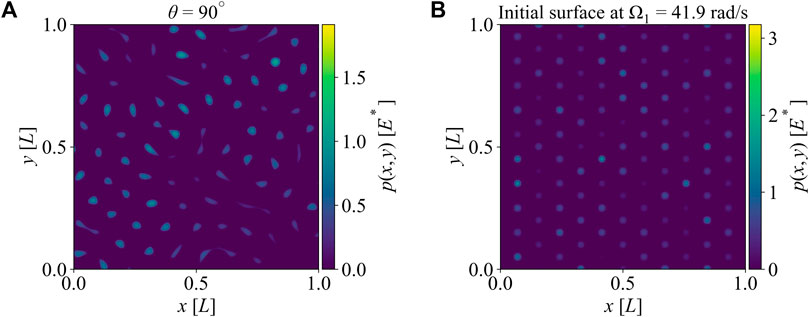
FIGURE 4. The images of the local pressures over the surfaces. (A) The local pressure for the surface generated by spinodal decomposition at θ = 90° (isotropic surface) (B) The local pressure for the surface generated by amplified instability at Ω1 = 41.9 rad/s.
2.2.2 Theoretical contact models
To verify, compare and contrast our numerical results with existing contact theories, we will adopt the following models for different cases.
• For comparison to the anisotropic spinodal surface, we will use 2D-sinusoidal contact formulations (Johnson, 1985). This choice is apparent from Figure 1A, which is created by limiting the direction vector to within θ ≈ 0° and thus surface heights vary along the x-axis only. The ratio of real to nominal areas of contact Ar/A0 and the contact pressures p(x) for 2D-sinusoidal surface h (x, y) ≈ z(x) = Δ cos (2πx/λ) are given as Eqs 6, 7, where a is the half contact width at each peak, and p* = πE*Δ/λ;
• For comparison to isotropic spinodal surfaces, we adopt discrete Greenwood-Williamson model (GW model) because randomly-sampled spinodal surfaces tend to possess an average wave number of k = 2π (Eq. 2) leading to well-separated surface peaks, and thus we can describe the curvature of the peaks separately and treat them as non-interacting asperities under light loading (Greenwood and Williamson, 1966). Assuming elliptical Hertzian contact for each peak, the normal load
The effective radius of curvature
• For comparison to surfaces generated by the amplified instability method, we adopt discrete GW model for the same basis as in the isotropic spinodal surface: The droplets and hairs created by this method can be assumed as isolated asperities. We can estimate the normal load
2.3 Tangential contact analysis
We conduct the combined normal and tangential contact analysis via Tamaas to study the effect of shear tractions on the stress concentration factor. We simulate the 3D non-adhesive elastic contact under combined normal and tangential loading by the conjugate gradient method (Polonsky and Keer, 1999). The mechanical properties are the same as the normal loading simulations. The value of 0.5 for Poisson’s ratio allows us to remove the elastic mismatch (Patil and Eriten, 2015) and enables us to verify the numerical simulations against the theoretical Cattaneo–Mindlin model for a sphere-on-flat contact (Johnson, 1985). To limit shear tractions, Coulomb friction model with friction coefficient μ is used. We assign boundary conditions with two nominal tractions: mean pressure p0 in z direction (normal to the surface); and mean shear traction qx in x direction (in our case, qy = 0). In tangential contact analysis, we set the mean pressure p0 at 0.0316E* and mean shear traction at qx = 0.7 μp0. Note that this selection of mean shear traction delivers significant contributions to stress concentrations without leading to gross sliding.
After each simulation, we obtain x, y, and z components of tractions, namely, tx (x, y), ty (x, y), and tz (x, y), and compute an equivalent traction
3 Results
3.1 Real area of contact and mean contact pressures
3.1.1 Spinodal decomposition
Figures 5A, B show the real area of contact normalized by the nominal area Ar/A0 and real mean contact pressure pr as a function of mean pressure p0 for two extreme cases: θ ≈ 0° and θ = 90°. Note that those cases correspond respectively to the most anisotropic (2D sinusoidal) and isotropic patterns shown in Figure 1. For each case, 20 randomly sampled surfaces are realized with randomly selected direction vectors and phase angle per wave components Eq. 2. The mean and ± 1 standard deviation of the responses of those 20 surfaces are shown in Figure 5 and the subsequent figures. As expected for both cases, the real area of contact is less than a few percent of the nominal area at light loading (p0 ≈ 10−3E*). Around that light-loading asymptote, discrete GW simulations overlap nearly perfectly with the numerical solutions, which further verifies the numerical modeling. 2D sine contact theory correlates with the numerical solutions of the anisotropic case even at heavier loads reaching up to p0 ≈ E*. At that level of loading, complete contact condition is attained; i.e., Ar ∼ A0. 2D sine contact theory also predicts that complete contact is reached when p0 = p* = πE*Δ/λ, which is
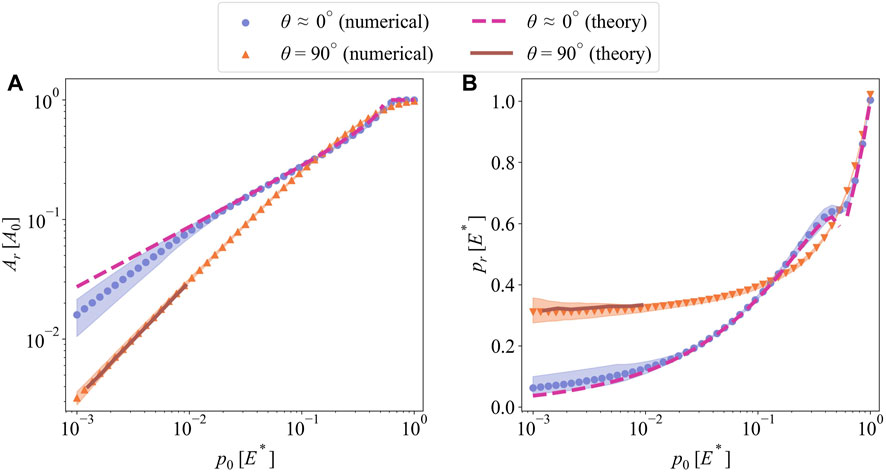
FIGURE 5. (A) The real area of contact Ar and (B) the real mean contact pressure pr as a function of nominal mean pressure p0 for the surfaces generated by spinodal decomposition with θ ≈ 0° (anisotropic) and θ = 90° (isotropic).
Reduction in the real load-bearing areas leads the inevitable increase in real mean contact pressures. Figure 5B shows the real mean contact pressures pr obtained from the simulations and contact theories. The real mean contact pressures at light loading (p0 < 0.01E*) are constant around 0.3E* for the isotropic patterns. Discrete GW model predicted similar values. The continuous form of GW model with randomly rough surfaces also predicts a constant real mean contact pressure independent of the applied load. This is thanks to the proportional increase of load-bearing areas with increasing load. For the anisotropic case, real mean contact pressures increase nonlinearly with the applied load and 2D sinusoidal contact solution captures that change reasonably well. At heavier loads (p0 > 0.1E*), both anisotropic and isotropic patterns deliver similar real areas of contact and mean contact pressures. At that asymptote, sensitivity to the initial patterns is lost through long-range interactions, shape alterations, and mergers among contact patches. Similar observations were reported elsewhere with detailed numerical analysis of sinusoidal contacts (Yastrebov et al., 2014).
3.1.2 Amplified instability
Figures 6A, B show the real area of contact and the real mean contact pressure for the surfaces generated by amplified instability. Numerical simulations and corresponding discrete GW model predictions are plotted for three different instability cases. The first case is the initial surface rendered at Ω1 = 41.9 rad/s, and the second and third cases are created with incrementally increased rotating speeds corresponding to effective accelerations of geff = 137 m/s2 and geff = 271 m/s2, respectively. The second and third surfaces are originated from the same initial surfaces. Note that initial heights are selected randomly from an experimentally-measured distribution, which then leads to a slightly different set of peaks for each surface patterns. Twenty surfaces are rendered at each case to determine statistically-relevant contact parameters numerically. The discrete GW model is obtained for one of those surfaces delivering mean values of the contact parameters shown in Figure 6. The shaded area represents the mean ± 1 standard deviation of numerical results for 20 surfaces per case. Similar to spinodal surfaces, all of the cases deliver contact areas much smaller than the nominal area under light loading. Besides, the real area of contact seems proportional to the applied load, which leads to constant real mean contact pressures at that extreme (p0 < 0.01E*). The real area of contact is consistently the smallest for high effective acceleration cases and highest for the initial surfaces, and vice versa is true for the real mean contact pressure. As the effective acceleration increases, so do the stretch of initial droplets and the height of individual hairs. Besides, the curvature for stretched hairs increases with the effective acceleration as shown in Figure 2. Both of those changes in geometry lead to less contact area and more stress concentration.
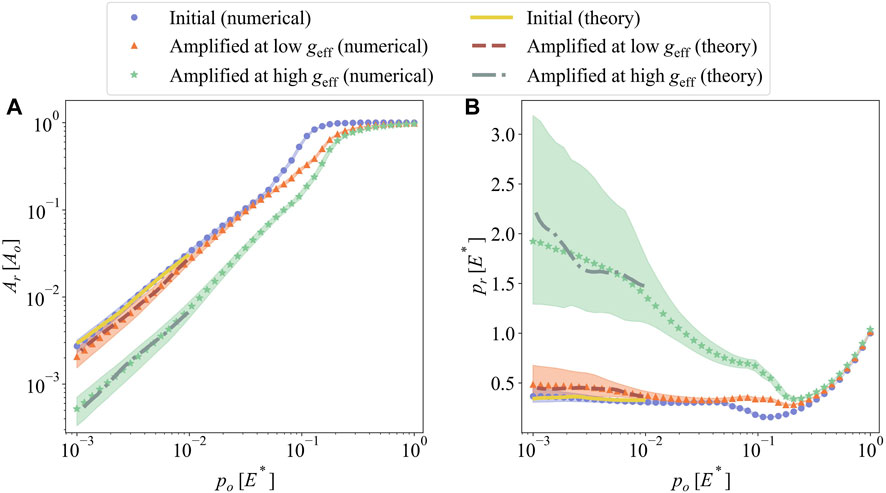
FIGURE 6. (A) The real area of contact Ar and (B) the real mean contact pressure pr as a function of nominal mean pressure p0 for the surfaces generated by amplified instability at three stages: after initial rotation, after low and after high effective acceleration geff.
The real mean contact pressure pr for the initial surfaces and the surfaces created at low geff is almost constant from 0.35E* to 0.45E*, while the surfaces created at high geff show decreasing real mean contact pressure for p0 < 0.1E*. This will be discussed in detail in Section 4 with the asperity curvatures and asperity heights. In Eq. 4, the stretch ɛ increases as α increases, and α is linearly proportional to the initial droplet height h0. Consequently, the variance in the initial surface’s asperity heights may result in a wider range of variance in amplified surfaces. We can see the shaded area is getting larger as the increased rotating speed Ω2 is getting higher.
3.2 Stress concentration
The real mean contact pressures shown above ranged from 0.05E* to 2.0E* at light loading. Such high pressures can be accommodated without failure only by highly flexible soft materials. The stress concentration at the peaks of surface patterns discussed above, however, will result in actual contact patches experiencing much larger pressures than pr, and thus permanent deformation and catastrophic failure is possible even for soft materials. Here, we investigate the stress concentrations pconc over the surfaces generated by the spinodal decomposition and amplified instability.
3.2.1 Spinodal decomposition
Figure 7 shows the evolution of stress concentration pconc on anisotropic and isotropic spinodal surfaces as a function of applied nominal pressure p0. As defined in Section 2, pconc is essentially the ratio of maximum and real mean contact pressures. The stress concentration for both the anisotropic and isotropic surface patterns starts at values ranging from 200 to 800, decreases monotonically with increasing nominal pressures, and converges to about 2 under heavy loading. The factor of 2 is common to any wavy pattern at the inception of complete contact. Except for that heavy-loading asymptote, isotropic patterns experience higher stress concentration than anisotropic patterns.
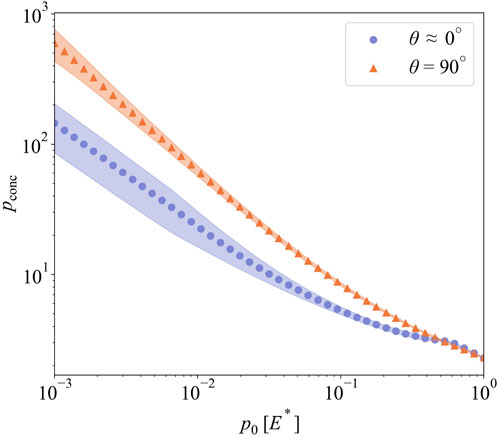
FIGURE 7. The stress concentration for the surfaces generated by spinodal decomposition.
3.2.2 Amplified instability
Figure 8 shows the evolution of stress concentration pconc on the surfaces created by amplified instability as a function of applied nominal pressure p0. Three cases of amplified instability are investigated as above: after initial rotation, after low, and after high effective acceleration. Similar to the spinodal surfaces, stress concentration starts at high values ranging around from 103 to 104 under low nominal pressures, decreases monotonically, and approaches 2 under high nominal pressures. The patterns created at high effective acceleration (geff = 271 m/s2) exhibit higher stress concentration than the other patterns. This is because the initial droplets get taller and sharper as effective acceleration increases (see, for example, Figure 2).
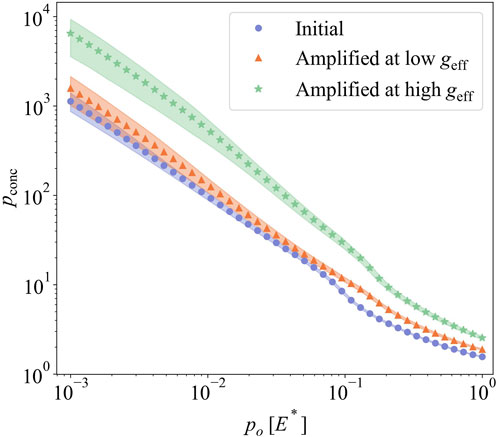
FIGURE 8. The stress concentration for the surface generated by amplified instability from numerical results.
4 Parametric study and discussion
Surface patterns created by the spinodal decomposition and amplified instability deliver contact responses that inherently depend on processing parameters. For instance, limiting the spinodal decomposition by angle θ controls the degree of anisotropy in the resulting patterns. As shown in Figure 7, isotropic patterns experience about 2.5 times the stress concentration that fully anisotropic (2D-sine wave) patterns do under light loading. For patterns created by amplified instability, increasing effective acceleration results in taller and sharper peaks and that leads to more than 3-fold increase in stress concentration compared to the initial droplets under light loading (Figure 8). Those differences vanish under heavy loading due to all surfaces approaching complete contact conditions. Next, we conduct a parametric study to determine the sensitivity of the contact responses to the above-mentioned processing parameters.
4.1 Influence of anisotropy in spinodal decomposition
To investigate the influence of anisotropic spinodal decomposition on the contact response, we simulate 20 surfaces generated using Eq. 2 at
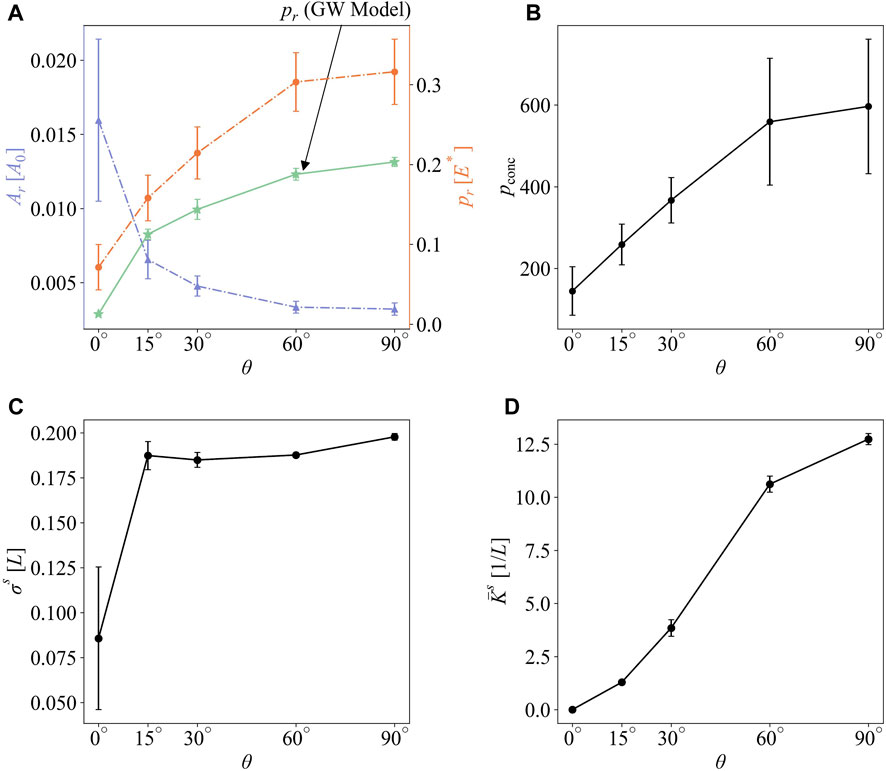
FIGURE 9. (A) The real area of contact (left, blue) and real mean contact pressure (right, orange), (B) the stress concentration, (C) the rms asperity height, and (D) the average effective curvature of asperity vs. directional parameter θ.
4.2 Influence of acceleration in amplified instability
The extent of stretch ɛ by effective centrifugal acceleration is a function of α = ρgeffh0/G. For identical material and droplet height, α is proportional to the effective centrifugal acceleration geff, but inversely proportional to the elastic resistance of the drop G. The elastic resistance of the drop G depends on curing time and temperature, and thus determining its value is difficult during processing. Because of those difficulties, we will use the combined nondimensional parameter ρgefflc/G instead in the parametric study, where the characteristic length
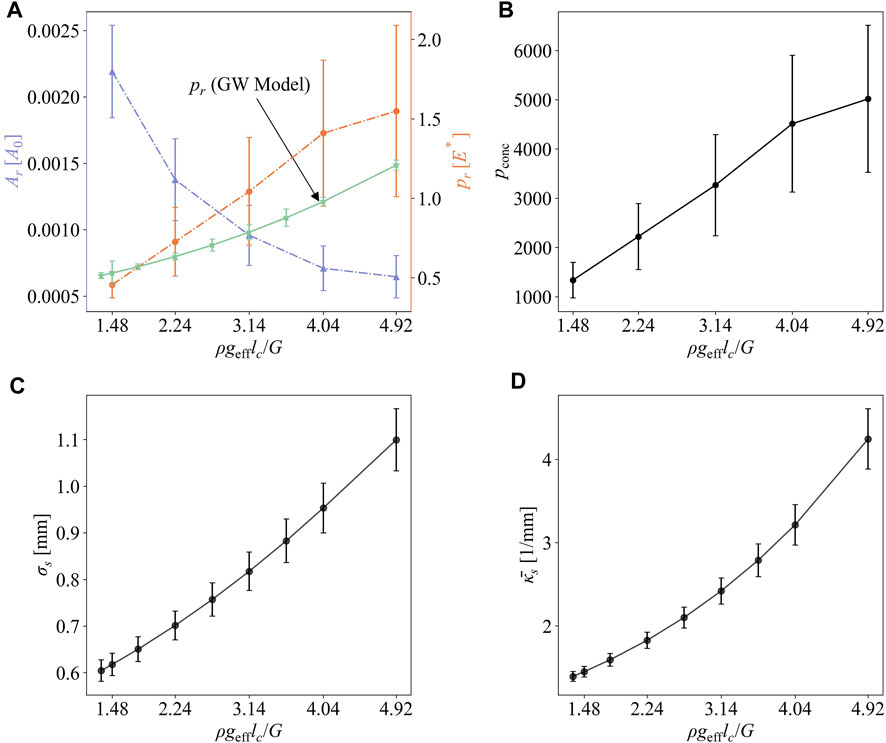
FIGURE 10. (A) The real area of contact (left, light blue) and real mean contact pressure (right, orange), (B) the stress concentration, (C) the rms asperity height, and (D) the average curvature of asperity vs. ρgefflc/G.
4.3 Influence of tangential loading
Lastly, we study the influence of combined loading on the above-mentioned stress concentration factors. Figure 11 shows the percent increment of stress concentration factors as a function of friction coefficient μ for three surface patterns: the isotropic spinodal patterned surface (θ = 90°), the anisotropic spinodal patterned surface (θ ≈ 0°) and the initial droplets generated by the amplified instability. Note that we simulate each surface at a mean pressure of p0 = 0.0316E* and a mean shear traction of qx = 0.7 μp0, which corresponds to pre-sliding contact globally. Therefore, increasing friction coefficients simulate an increase in applied shear traction. Since the percent increment is estimated with respect to the stress concentration factors under pure normal loading, pconc,0, it reveals the influence of added shear traction. It can be observed that the stress concentration factors increase with increasing shear tractions for all cases, but the increment is limited to 5% compared to the values for pure normal loading. Those findings confirm that the frictional tractions play a secondary role in stress concentrations where the primary factor is the processing parameters determining the degree of randomness in pattern geometry.
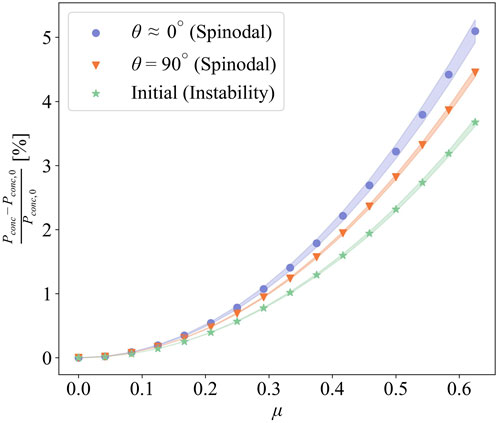
FIGURE 11. Percent increment of stress concentration as a function of friction coefficient in three representative surfaces.
5 Discussion and conclusion
In this paper, we have studied the real contact areas and tractions on the patterned surfaces generated by spinodal decomposition and amplified instability and reported how geometric randomness in the resulting patterns leads to stress concentrations under contact loading. On the surfaces generated by spinodal decomposition, the isotropic patterns deliver smaller real contact areas and thus higher real mean contact pressures and stress concentrations compared to the anisotropic patterns. Commonly, surfaces and metamaterials produced by spinodal decomposition are made of metals or ceramics. The stress concentration factors we report here suggest that nominal stresses are amplified by orders of magnitude in such surfaces under external or self-contact loading. Hence, local yielding or fracture is inevitable. Those local failures will hinder mechanical strength and resilience, and thus durability of the materials. On the surfaces generated by amplified instability, a similar reduction in the real contact area and increase in stress concentrations occur with increasing effective acceleration during patterning. At higher effective accelerations, the hair patterns exhibit broader variation in both height and curvature, and thus some hairs carry tractions that are 3 orders of magnitude higher than the nominal mean contact pressures. In general, the amplified instability method is used in patterning gels and elastomers. Both groups of materials have specific material formulations that can sustain large deformations without permanent failure. For instance, ultra-stretchable double network hydrogels can be synthesized to withstand stretches up to 100. Such hydrogels would be safe under contact loading even when patterned at the highest effective acceleration.
It is noteworthy that the stress concentrations reported here should be taken as an upper bound since we simulated linear elastic contact but in practice nonlinear material properties and failure would limit local tractions and deformations. The authors are currently working on experimental investigation of the above-mentioned surface patterns and the subsequent modeling will incorporate relevant material and failure models to inspect contact response more realistically.
Data availability statement
The original contributions presented in the study are included in the article/supplementary materials, further inquiries can be directed to the corresponding author.
Author contributions
WL and ME contributed to the conception and design of the study. WL conducted numerical simulations and analyses and wrote the first draft of the manuscript. All authors contributed to the article and approved the submitted version.
Funding
This research is partially funded by the US National Science Foundation (award numbers: CMMI-CAREER-1554146 and CMMI-2224380).
Conflict of interest
The authors declare that the research was conducted in the absence of any commercial or financial relationships that could be construed as a potential conflict of interest.
Publisher’s note
All claims expressed in this article are solely those of the authors and do not necessarily represent those of their affiliated organizations, or those of the publisher, the editors and the reviewers. Any product that may be evaluated in this article, or claim that may be made by its manufacturer, is not guaranteed or endorsed by the publisher.
References
Afshar-Mohajer, M., and Zou, M. (2020). Multi-scale in situ tribological studies of surfaces with 3d textures fabricated via two-photon lithography and replica molding. Adv. Mater. Interfaces 7, 2000299. doi:10.1002/admi.202000299
Askari, M., Hutchins, D. A., Thomas, P. J., Astolfi, L., Watson, R. L., Abdi, M., et al. (2020). Additive manufacturing of metamaterials: A review. Addit. Manuf. 36, 101562. doi:10.1016/j.addma.2020.101562
Bico, J., Tordeux, C., and Quéré, D. (2001). Rough wetting. Europhys. Lett. 55, 214–220. doi:10.1209/epl/i2001-00402-x
Cahn, J. W. (1961). On spinodal decomposition. Acta Metall. 9, 795–801. doi:10.1016/0001-6160(61)90182-1
Chen, S., Richter, B., Sridharan, K., Pfefferkorn, F., and Eriten, M. (2020). Patterning and fusion of alumina particles on S7 tool steel by pulsed laser processing. J. Manuf. Process. 60, 107–116. doi:10.1016/j.jmapro.2020.10.044
Davis, C. S., and Crosby, A. J. (2011). Mechanics of wrinkled surface adhesion. Soft Matter 7, 5373–5381. doi:10.1039/c1sm05146f
Dong, L., King, W. P., Raleigh, M., and Wadley, H. N. (2018). A microfabrication approach for making metallic mechanical metamaterials. Mater. Des. 160, 147–168. doi:10.1016/j.matdes.2018.09.008
Eriten, M., Usta, A. D., and Liu, L. (2016). Tuning the dissipation in friction dampers excited by depolarized waves across patterned surfaces. J. Vib. Acoust. 138. doi:10.1115/1.4033343
Frérot, L., Anciaux, G., Rey, V., Pham-Ba, S., and Molinari, J.-F. (2020). Tamaas: A library for elastic-plastic contact of periodic rough surfaces. J. Open Source Softw. 5, 2121. doi:10.21105/joss.02121
Greenwood, J. (1997). Analysis of elliptical hertzian contacts. Tribol. Int. 30, 235–237. doi:10.1016/s0301-679x(96)00051-5
Greenwood, J. A., and Williamson, J. P. (1966). Contact of nominally flat surfaces. Proc. R. Soc. Lond. Ser. A. Math. Phys. Sci. 295, 300–319. doi:10.1098/rspa.1966.0242
Guell Izard, A., Bauer, J., Crook, C., Turlo, V., and Valdevit, L. (2019). Ultrahigh energy absorption multifunctional spinodal nanoarchitectures. Small 15, 1903834. doi:10.1002/smll.201903834
Hodge, A., Biener, J., Hayes, J., Bythrow, P., Volkert, C., and Hamza, A. (2007). Scaling equation for yield strength of nanoporous open-cell foams. Acta Mater. 55, 1343–1349. doi:10.1016/j.actamat.2006.09.038
Holmes, D. P., Ursiny, M., and Crosby, A. J. (2008). Crumpled surface structures. Soft Matter 4, 82–85. doi:10.1039/b712324h
Hsieh, M.-T., Endo, B., Zhang, Y., Bauer, J., and Valdevit, L. (2019). The mechanical response of cellular materials with spinodal topologies. J. Mech. Phys. Solids 125, 401–419. doi:10.1016/j.jmps.2019.01.002
Jambon-Puillet, E., Piéchaud, M. R., and Brun, P.-T. (2021). Elastic amplification of the Rayleigh–taylor instability in solidifying melts. Proc. Natl. Acad. Sci. 118, e2020701118. doi:10.1073/pnas.2020701118
Ku, T., Ramsey, J., and Clinton, W. (1968). Calculation of liquid droplet profiles from closed-form solution of young-laplace equation. IBM J. Res. Dev. 12, 441–447. doi:10.1147/rd.126.0441
Kumar, S., Tan, S., Zheng, L., and Kochmann, D. M. (2020). Inverse-designed spinodoid metamaterials. npj Comput. Mater. 6, 73–10. doi:10.1038/s41524-020-0341-6
Lee, M. N., and Mohraz, A. (2010). Bicontinuous macroporous materials from bijel templates. Adv. Mater. 22, 4836–4841. doi:10.1002/adma.201001696
Lister, J. R., Rallison, J. M., and Rees, S. J. (2010). The nonlinear dynamics of pendent drops on a thin film coating the underside of a ceiling. J. fluid Mech. 647, 239–264. doi:10.1017/s002211201000008x
Marthelot, J., Strong, E., Reis, P. M., and Brun, P.-T. (2018). Designing soft materials with interfacial instabilities in liquid films. Nat. Commun. 9, 4477–7. doi:10.1038/s41467-018-06984-7
Matsuda, T., Kawakami, R., Namba, R., Nakajima, T., and Gong, J. P. (2019). Mechanoresponsive self-growing hydrogels inspired by muscle training. Science 363, 504–508. doi:10.1126/science.aau9533
Mu, Q., Cui, K., Wang, Z. J., Matsuda, T., Cui, W., Kato, H., et al. (2022). Force-triggered rapid microstructure growth on hydrogel surface for on-demand functions. Nat. Commun. 13, 6213. doi:10.1038/s41467-022-34044-8
Patil, D. B., and Eriten, M. (2015). Frictional energy dissipation in spherical contacts under presliding: effect of elastic mismatch, plasticity and phase difference in loading. J. Appl. Mech. 82. doi:10.1115/1.4029020
Perris, J., Xu, Y., Kartal, M. E., Gadegaard, N., and Mulvihill, D. M. (2021). Tailorable and repeatable normal contact stiffness via micropatterned interfaces. Tribol. Lett. 69, 106–112. doi:10.1007/s11249-021-01473-3
Polonsky, I., and Keer, L. (1999). A numerical method for solving rough contact problems based on the multi-level multi-summation and conjugate gradient techniques. Wear 231, 206–219. doi:10.1016/s0043-1648(99)00113-1
Portela, C. M., Vidyasagar, A., Krödel, S., Weissenbach, T., Yee, D. W., Greer, J. R., et al. (2020). Extreme mechanical resilience of self-assembled nanolabyrinthine materials. Proc. Natl. Acad. Sci. 117, 5686–5693. doi:10.1073/pnas.1916817117
Vidyasagar, A., Krödel, S., and Kochmann, D. M. (2018). Microstructural patterns with tunable mechanical anisotropy obtained by simulating anisotropic spinodal decomposition. Proc. R. Soc. A Math. Phys. Eng. Sci. 474, 20180535. doi:10.1098/rspa.2018.0535
Wang, C., Vangelatos, Z., Grigoropoulos, C. P., and Ma, Z. (2022). Micro-engineered architected metamaterials for cell and tissue engineering. Mater. Today Adv. 13, 100206. doi:10.1016/j.mtadv.2022.100206
Yastrebov, V. A., Anciaux, G., and Molinari, J.-F. (2014). The contact of elastic regular wavy surfaces revisited. Tribol. Lett. 56, 171–183. doi:10.1007/s11249-014-0395-z
Keywords: contact mechanics, real area of contact, stress concentration, spinodal decomposition, elastic amplification
Citation: Lee W and Eriten M (2023) Real area of contact and tractions on the patterned surfaces generated by spinodal decomposition and amplified instability. Front. Mech. Eng 9:1253207. doi: 10.3389/fmech.2023.1253207
Received: 05 July 2023; Accepted: 12 September 2023;
Published: 25 September 2023.
Edited by:
Robert Jackson, Auburn University, United StatesReviewed by:
Akihiro Nakatani, Osaka University, JapanAli Beheshti, George Mason University, United States
Copyright © 2023 Lee and Eriten. This is an open-access article distributed under the terms of the Creative Commons Attribution License (CC BY). The use, distribution or reproduction in other forums is permitted, provided the original author(s) and the copyright owner(s) are credited and that the original publication in this journal is cited, in accordance with accepted academic practice. No use, distribution or reproduction is permitted which does not comply with these terms.
*Correspondence: Melih Eriten, eriten@wisc.edu