Geriatric nutrition risk index in the prediction of all-cause and cardiovascular mortality in elderly hypertensive population: NHANES 1999–2016
 Xuan Huo1
  Yilun Hang
- 1Department of Cardiology, Zhejiang Medical and Health Group Hangzhou Hospital, Zhejiang, China
- 2Department of Endocrinology, The First People's Hospital of Yuhang District, Hangzhou, China
- 3Department of Medical Oncology, Zhejiang Medical and Health Group Hangzhou Hospital, Zhejiang, China
Background: Hypertension is a major risk factor for the global burden of disease, and nutrition is associated with an increased risk of mortality from multiple diseases. Few studies have explored the association of nutritional risk with all-cause mortality and cardiovascular mortality in hypertension, and our study aims to fill this knowledge gap.
Method: We included data from the National Health and Nutrition Examination Survey (NHANES) from 1999 to 2016 on a total of 10,037 elderly patients with hypertension. The nutritional status was evaluated using the Geriatric Nutrition Risk Index (GNRI). Kaplan-Meier survival analysis was performed to analyze the survival rates of different nutritional risk groups. COX proportional risk regression models were used to analyze the predictive effect of GNRI on all-cause mortality and cardiovascular mortality in hypertensive patients. Restricted cubic splines (RCS) were used to explore the nonlinear relationship between GNRI and mortality.
Result: The mean age of the hypertensive patients was 70.7 years. A total of 4255 (42.3%) all-cause mortality and 1207 (17.2%) cardiovascular mortality occurred during a median follow-up period of 106 months. Kaplan-Meier showed a more significant reduction in survival for the moderate to severe malnutrition risk of GNRI. The adjusted COX proportional hazards model showed that the hazard ratios for all-cause mortality and cardiovascular mortality in the moderate to severe malnutrition risk group for GNRI were 2.112 (95% CI, 1.377,3.240) and 2.604 (95% CI, 1.603,4.229), respectively. The RCS showed that increased GNRI was associated with a reduced risk of all-cause mortality and cardiovascular mortality risk reduction.
Conclusion: Malnutrition exposure assessed by GNRI effectively predicts the risk of all-cause mortality and cardiovascular mortality in the elderly with hypertension.
Introduction
Hypertension is a common chronic disease (1), with the World Health Organization (WHO) reporting that hypertension affects up to 40% of adults worldwide and that its prevalence continues to increase (2), thus hypertension has become a significant contributing risk factor to the global burden of disease (3). Prolonged elevated blood pressure leads to vascular endothelial dysfunction, sustained activation of inflammatory factors, and end-organ damage (4), therefore hypertension is significantly associated with cardiovascular disease (CVD), which causes approximately 7.5 million mortality worldwide (5).
Malnutrition is associated with the increasing prevalence of hypertension (6), and nutritional status is related to vascular endothelial damage repair, antioxidants, and antithrombosis (7). A systematic review showed that malnutrition was independently associated with increased length of ICU stay, ICU readmission rates, infection rates, and in-hospital mortality (8). To date, several studies have demonstrated that malnutrition is strongly associated with all-cause and cardiovascular mortality in patients (9–11). Some studies have shown an association between low body mass index and all-cause mortality in patients with hypertension (12). Hypertension and malnutrition can seriously affect the subjective quality of life, and life expectancy of hospitalized patients. The study (13) has shown that malnutrition shows a significant correlation with increased levels of the inflammatory response, and atherosclerosis progression, which may further increase the likelihood that it plays an important role in increasing cardiovascular-related events.
The Geriatric Nutrition Risk Index (GNRI), a simple nutritional assessment tool, is a new indicator to estimate geriatric internal medicine patients at high risk (14). Recent studies have shown that a high risk of malnutrition assessed by GNRI predicts the risk of death in patients with chronic kidney disease, cancer and diabetes (15–17). However, studies on GNRI as a predictor of all-cause mortality and cardiovascular mortality risk in hypertension are still limited, especially in the elderly. The United Nations defines people over 60 years of age as elderly (18). No study has yet validated the association between GNRI and all-cause and cardiovascular mortality in hypertensive patients, and our study aims to fill this knowledge gap.
Methods
Study design and study population
This retrospective cohort study was based on the National Health and Nutrition Examination Survey (NHANES) - a large national survey of the United States civilian population conducted by the Centers for Disease Control and Prevention's National Center for Health Statistics. The NHANES data were collected through a complex multi-stage probabilistic design that identifies strata based on geography and a certain percentage of the minority population (19). Furthermore, this study was supported by the National Center for Health Statistics Research Ethics Review Board, you can find it on this website: https://www.cdc.gov/nchs/nhanes/irba98.html. And the ethics approval numbers Protocol #98-12, Protocol #2005-06, Continuation of Protocol#2005-06, Protocol #2011-17and Continuation of Protocol#2011-2017. All participants provided written informed consent.
Data for the analysis were taken from NHANES 1999–2016 with a total of 91,964 participants. In the present study, we included people aged ≥60 years and excluded subjects without serum albumin, height, weight, follow-up data, and without hypertension disease. After applying the above criteria, 10,037 participants were finally included (Figure 1).
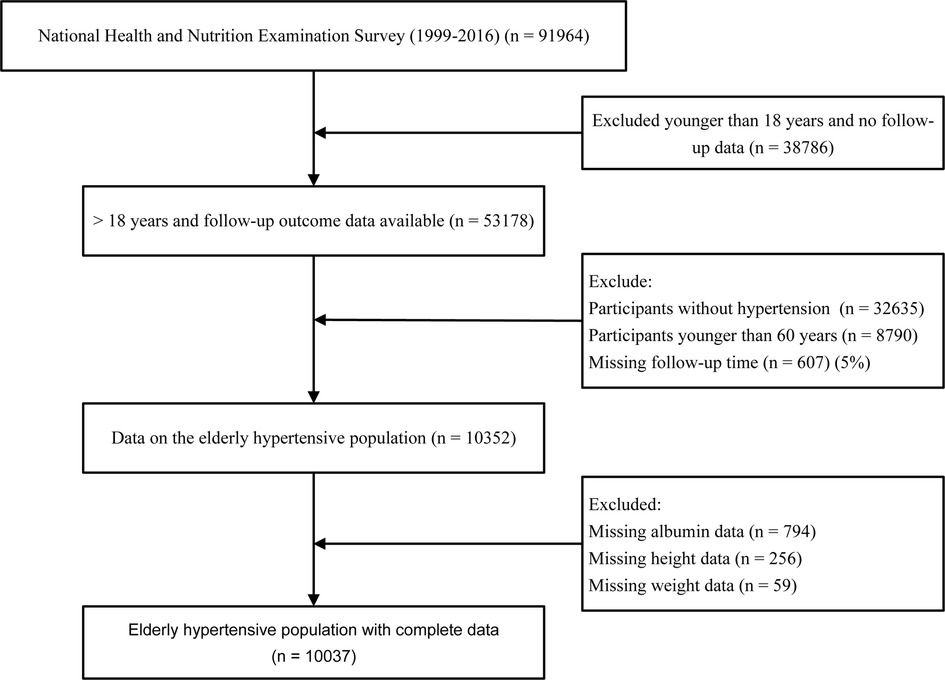
Figure 1. Flow diagram for the selection of the study population.
Nutritional status assessment
The Geriatric Nutrition Risk Index was calculated as GNRI = [1.489 × serum albumin (g/L)] + (41.7 × weight (kg)/ideal weight (kg)) The ideal weight was calculated by the following Lorenz equation: 22 × square of height. If the patient's weight exceeded the ideal weight, the ratio of weight to ideal weight was set to 1 (14). Classification of patients was based on the following thresholds: moderate to severe risk of malnutrition: <92; low risk: 92 to 98; no risk: >98 (17).
Definition of hypertension
A history of hypertension and antihypertensive medication was collected by questionnaire. Blood pressure was measured by a trained physician using a mercury sphygmomanometer with an appropriately sized cuff. Blood pressure measurements were performed three times and the average of the three measurements was defined as systolic blood pressure (SBP) and diastolic blood pressure (DBP). Hypertension was defined as having a self-reported history of hypertension or use of antihypertensive medication or SBP ≥ 140 mmHg or DPB ≥ 90 mmHg.
Covariate assessments
We included patient demographic information, including age, gender, race, marital status, and education levels. Other covariates selected from previous literature reports or clinical experience that had an impact on the hypertensive population included body mass index (BMI), lymphocytes, neutrophils, serum creatinine, serum uric acid, triglycerides, fasting glucose, high density lipoprotein cholesterol (HDL-C), low density lipoprotein cholesterol (LDL-C), serum albumin, C-reactive protein (CRP), sodium and salt intake, smoking, alcohol consumption, physical activity, diabetes, cardiovascular disease, and chronic kidney disease (20). Race was categorized as Mexican American, non-Hispanic white, non-Hispanic black, or other. Education levels were classified as less than 9th Grade, and higher than 9th Grate or 9th Grate. Marital status was categorized as with partner (married or living with a partner), without partner (widowed, divorced, or separated), or never married. Body mass index (BMI) was calculated by the following formula: BMI = weight (kg)/height2 (m2) (21). The sodium and salt intake were assessed from a 24-hour recall questionnaire (22). According to the median sodium and salt intake, there were “high sodium and salt intake” and “low sodium and salt intake” groups. Participants were categorized as “mild”, “moderate or heavy”, “former” and “never” based on the number of drinks per day he/she had drunk (23). Participants who were “mild” were considered to be drinking alcohol ≤1 drink in women and ≤2 drinks in men; Participants who were “heavy” were considered to be drinking alcohol ≤2 drinks in women and ≤3drinks in men or individuals had drunk ≥3 drinks of woman and ≥4drinks of man; Participants who used to drink alcohol but do not drink now are defined as “former” and never drink alcohol is defined as “never”. Smoking status was defined as the number and timeline of cigarettes in life (never, smoked less than 100 cigarettes; former, smoked more than 100 cigarettes in life and smoke not at all now; now, smoked more than 100 cigarettes in life and smoke some days or every day). Physical activity was classified as ideal [≥8,000 metabolic equivalent task (MET) minutes/week], intermediate (600–7,999 MET minutes/week), and poor (<600 MET minutes/week) (24). Definition of cardiovascular disease: data were obtained from self-report data from the personal interview: “Have you ever been told by a doctor or other health professional that you have CHF (Congestive Heart Failure)/CHD (Coronary Heart Disease) /angina/heart attack/stroke?” If any of the above questions were answered in the affirmative, CVD was considered to be present. Glomerular filtration rate (eGFR) was estimated using the Chronic Kidney Disease Epidemiology Collaboration (CKD-EPI-2009) creatinine equation (25). Chronic kidney disease (CKD) was defined as estimated eGFR < 60 ml/min/1.73 m2 (26). Diabetes mellitus was defined as meeting one of the following conditions: the doctor told you have diabetes, glycohemoglobin (HbA1c) (%) > 6.5, fasting glucose (mmol/L) ≥ 7.0, random blood glucose (mmol/L) ≥ 11.1, 2-hour oral glucose tolerance test (OGTT) blood glucose (mmol/L) ≥ 11.1 and use of diabetes medication or insulin. Furthermore, we categorized the use of antihypertensive medications according to the latest American College of Cardiology/American Heart Association (ACC/AHA) guidelines for hypertension (27). These included Beta blockers, Calcium channel blockers, Angiotensin-Converting Enzyme Inhibitors/Angiotensin II receptor antagonists (ACEI/ARB), and Diuretics.
Statistical analysis
Statistical analyses of data from this study were performed using R software (The R Foundation; http://www.r-project.org; version 4.2.2). NHANES created weights to account for the complex survey design, survey nonresponse, and post-stratification adjustments to match the total population residing in the United States. Therefore, in all the following analyses, we weighted the samples according to NHANES analysis guidelines (28).
Initially, the baseline characteristics of patients were compared by dividing the sample into three groups: no-risk, low-risk, and moderate-to-severe risk of adverse events according to GNRI thresholds. Continuous variables were expressed as weighted means ± standard deviations. Differences between the 3 study groups were analyzed by One-way analysis of variance (ANOVA). Categorical variables were expressed as numbers and percentages and compared using the Rao-Scott chi-squared test. NHANES public-use linked mortality file data as of December 31, 2019 were used to determine the mortality status of the follow-up population (29).Survival rates for different nutritional risk groups were then analyzed using the Kaplan-Meier survival analysis. Furthermore, Cox proportional hazard regression models were used to estimate hazard ratios (HRs) and 95% confidence intervals (CIs) for cardiovascular mortality and all-cause mortality. The nonlinear relationship between GNRI and the presence of all-cause mortality and cardiovascular mortality was examined using a multivariate-adjusted Cox restricted cubic spline regression model. Finally, subgroup analyses were performed stratified by sodium and salt intake, physical activity, cardiovascular disease, diabetes mellitus, and chronic kidney disease. In all of these analyses, a two-sided P < 0.05 was considered statistically significant.
Results
Baseline characteristics
A total of 10,037 elderly patients with hypertension were included in this study. Based on the calculation of the weights for each sample, our sample represents approximately 3,322,957 elderly hypertensive patients in the United States. The median follow-up time was 106 months. Baseline characteristics of the total population and groups according to different GNRI levels are listed in the table (Table 1). In the total population, the mean age of patients was 70.7 years and the mean GNRI was 104.1. Among the 3 groups compared by GNRI classification, age, lymphocyte count, neutrophil count, serum creatinine, triglycerides, LDL cholesterol, C-reactive protein, diastolic blood pressure, gender, race, marital status, cardiovascular disease, diabetes mellitus, chronic kidney disease, smoking, and alcohol consumption were statistically different (P < 0.05). Participants in the moderate to severe malnutrition risk group of GNRI (GNRI < 92) had higher lymphocytes, C-reactive protein levels, higher prevalence of diabetes, and chronic kidney disease. In addition, BMI, serum uric acid, HDL cholesterol, and systolic blood pressure were not statistically different (P > 0.05).
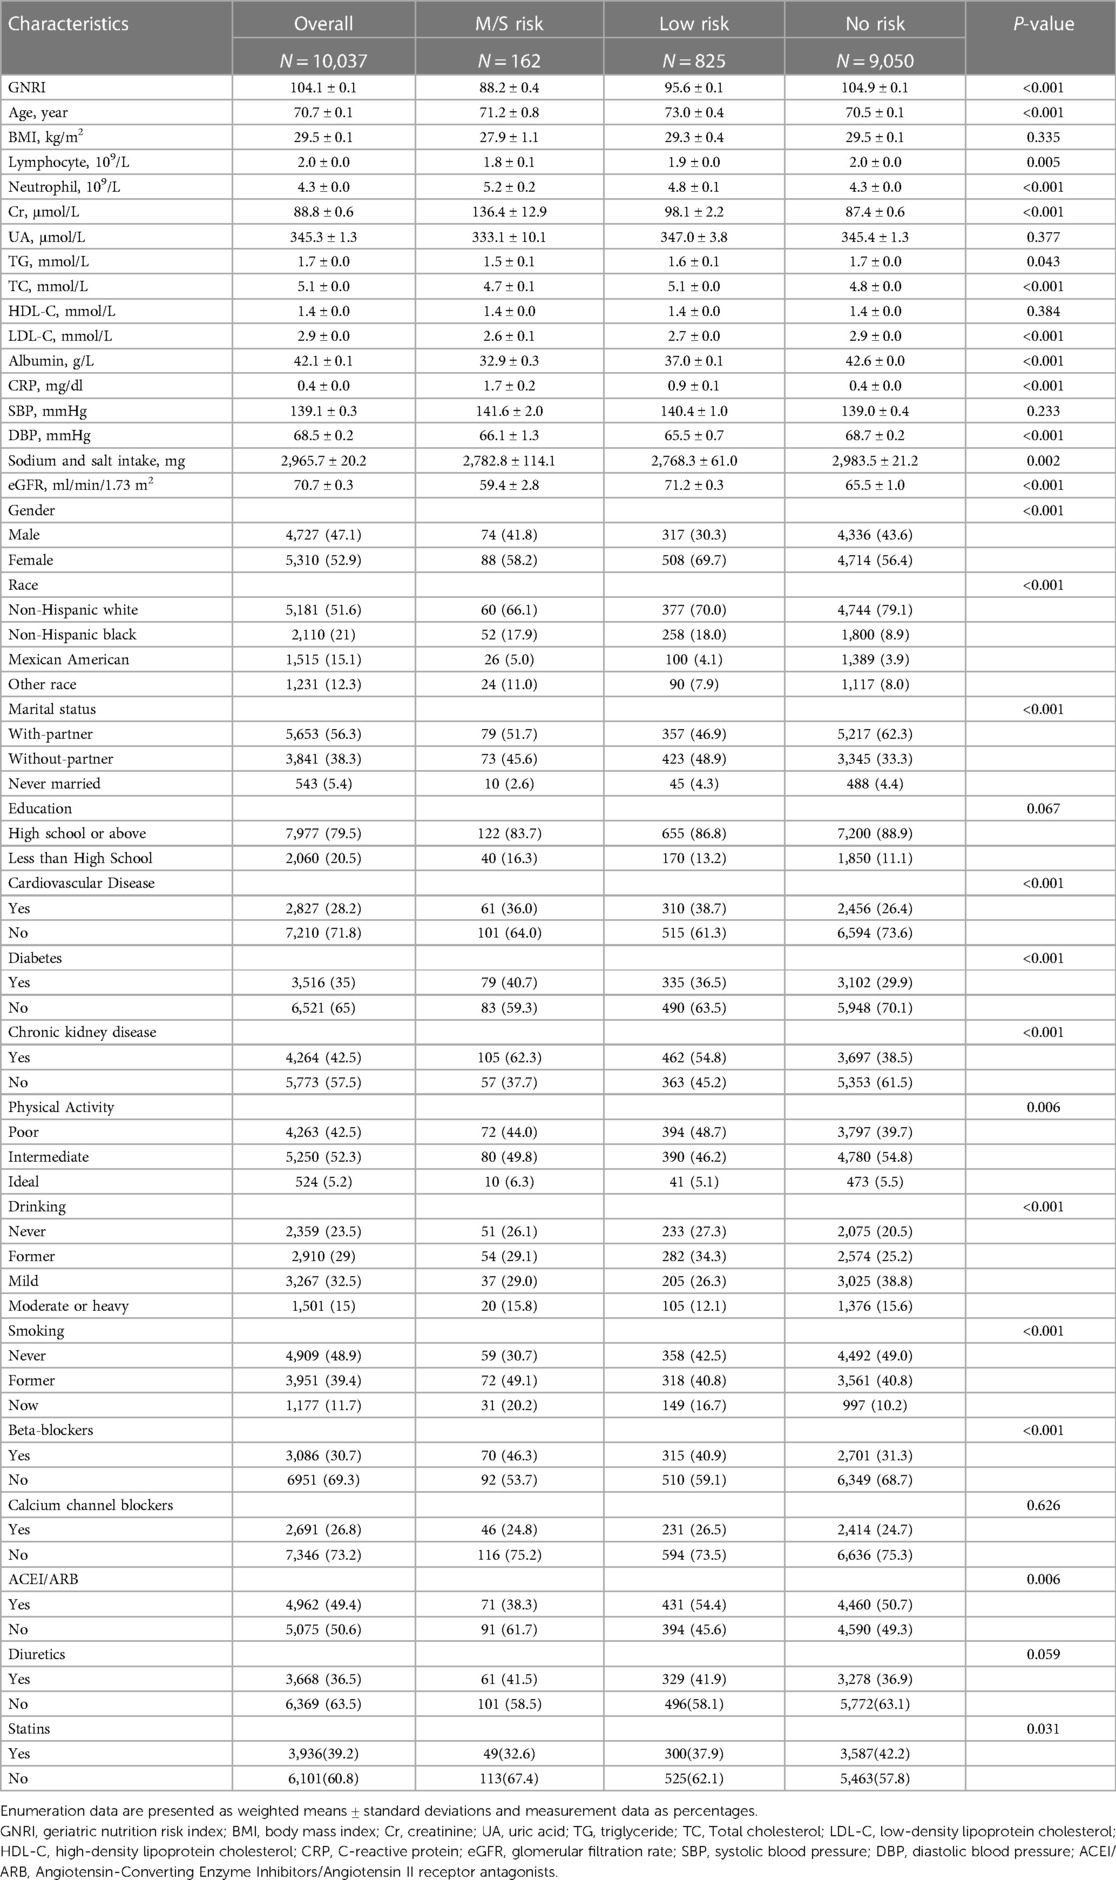
Table 1. Baseline characteristics of the elderly hypertensive population by GNRI groups.
The relationship between geriatric nutritional risk Index and mortality
During a median follow-up period of 106 months, 4255 (42.3%) all-cause mortality and 1207 (17.2%) cardiovascular disease mortality occurred in patients with hypertension. We used Kaplan-Meier to analyze survival between different groups at moderate to severe risk of malnutrition, low risk, and no risk of GNRI. The results showed that different levels of GNRI differed between all-cause and cardiovascular mortality (log-rank of trend p < 0.0001). The reduction in survival was more significant for moderate to severe malnutrition risk of GNRI for both all-cause and cardiovascular mortality (Figure 2).
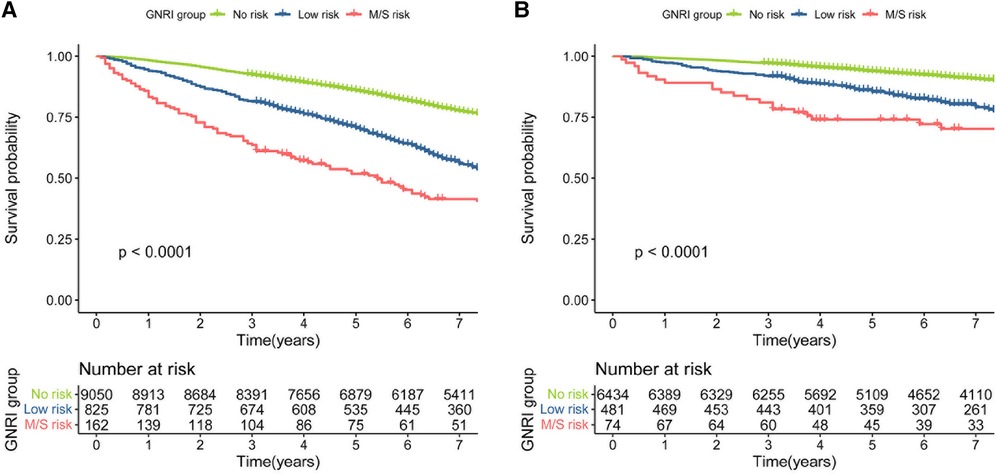
Figure 2. (A) kaplan–meier survival curve for all-cause mortality. (B) Kaplan–Meier survival curve for cardiovascular mortality.
In the COX proportional hazard regression model, GNRI is associated with the risk of all-cause mortality and cardiovascular mortality. In model 1, no variables were adjusted for. Elevated GNRI was associated with reduced risk of all-cause mortality and cardiovascular mortality [(HR, 0.941, 95% CI 0.933, 0.949) and [HR = 0.935, 95% CI (0.922, 0.949), respectively]. Similar findings were found for the adjusted Models 2, 3, and 4. And in the fully adjusted model 4, GNRI had hazard ratios of 0.958 (95% CI, 0.949, 0.967), and 0.956 (95% CI, 0.941, 0.972) for all-cause mortality and cardiovascular mortality, respectively. When GNRI was used as a categorical variable, the moderate to severe malnutrition risk of GNRI was shown to be associated with the risk of all-cause mortality and cardiovascular mortality in the unadjusted model with hazard ratios of 2.730 (95% CI, 2.006,3.714) and 2.891 (95% CI, 1.639,5.101), respectively. In the fully adjusted model (model 4), the hazard ratios for the risk of moderate to severe malnutrition in GNRI were 2.112 (95% CI, 1.377, 3.240) and 2.604 (95% CI, 1.603,4.229) for all-cause mortality and cardiovascular mortality, respectively (Table 2).

Table 2. COX proportional hazard regression analysis of GNRI and all-cause mortality and cardiovascular mortality in an elderly hypertensive population.
Nonlinear association between GNRI and all-cause and cardiovascular mortality
In a restricted cubic spline regression model (RCS) fully adjusted for confounders, the increase in GNRI was associated with a reduced risk of all-cause mortality and cardiovascular mortality in the elderly hypertensive population, but they both showed a non-linear trend (non-linear p < 0.001 and non-linear p = 0.015, respectively) (Figure 3).
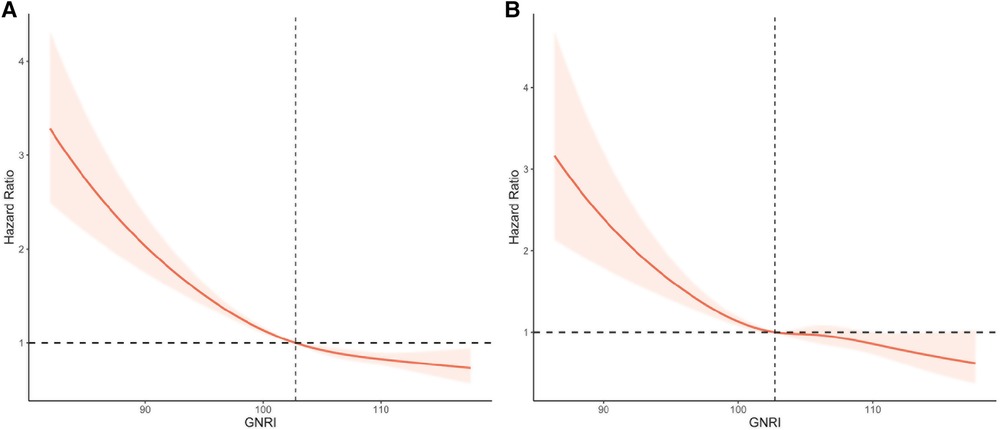
Figure 3. Restricted cubic splines of GNRI and mortality in elderly patients with hypertension. (A) All-cause mortality. (B) Cardiovascular mortality. Adjusted for age, gender, race, marital status, education, diabetes mellitus, cardiovascular disease, chronic kidney disease, diastolic blood pressure, systolic blood pressure, physical activity, smoking, drinking, lymphocytes, neutrophils, creatinine, uric acid, triglycerides, HDL, LDL, C-reactive protein, and medication (beta-blockers, calcium channel blockers, ACEI/ARB, diuretics, and statins).
Subgroup analysis
We examined the association between GNRI and all-cause mortality and cardiovascular mortality in the subgroup analysis (Table 3). The results showed that GNRI interacted with sodium and salt intake and physical activity in all-cause mortality. For cardiovascular mortality, there was no interaction between GNRI and sodium and salt intake, physical activity, cardiovascular disease, diabetes mellitus, and chronic kidney disease. In addition, GNRI was not associated with all-cause mortality and cardiovascular mortality in an older hypertensive population in which physical activity was ideal (P > 0.05).
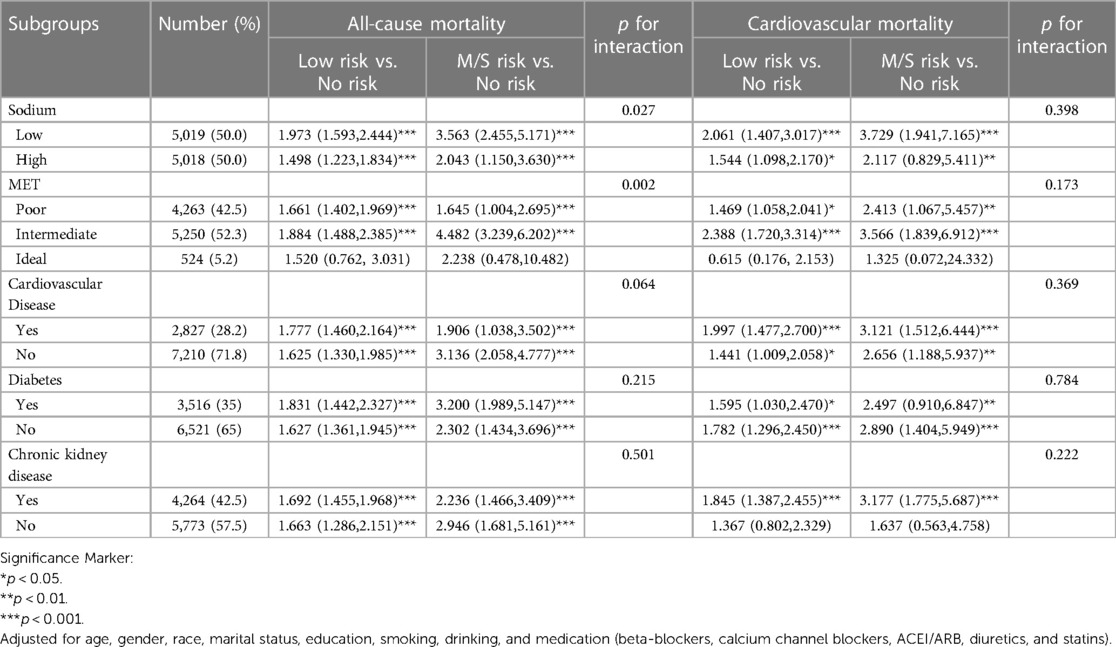
Table 3. Subgroup analysis of the association with GNRI (classification) and all-cause mortality and cardiovascular mortality in a hypertensive population.
Discussion
In this large retrospective cohort study, we included 10,037 elderly hypertensive individuals and assessed their nutritional status using the GNRI. Our sample size represented a population of approximately 33,227,957 older adults with hypertension in the United States. We first analyzed the survival rates of all-cause mortality and cardiovascular mortality in hypertensive patients with different nutritional risks using Kaplan-Meier. In addition, COX proportional hazard regression models revealed that GNRI-assessed risk of poor nutrition was associated with increased risk of all-cause mortality and cardiovascular mortality in the hypertensive population. Further, restricted cubic spline regression models revealed a nonlinear trend of GNRI with all-cause mortality and cardiovascular mortality. Finally, subgroup analysis showed that GNRI was associated with risk of mortality in different subgroups of the elderly hypertensive population.
Nutritional status is a particularly important factor in predicting mortality from various diseases (30, 31). Long-standing chronic diseases, such as hypertension, diabetes, and coronary heart disease, can cause malnutrition, exacerbate disease progression and affect patient prognosis (32, 33). The effect of nutritional status on the prevalence of hypertension and its prognosis has been demonstrated in several studies. A cohort study from rural China confirmed that low body mass index was associated with all-cause mortality in hypertensive patients (12). However, some studies have also shown a U-shaped relationship between BMI and mortality in hypertension (34). For overweight or obese individuals does not mean that there is adequate nutrition in the body (35). On the contrary, fat accumulation and obesity can also indirectly lead to further nutritional disorders in patients through metabolic and organismal composition changes and through acute and chronic diseases that can adversely affect the nutritional status (36). Therefore, GNRI nicely combines BMI with serum albumin levels to assess a person's nutritional status. Sun et al. showed that nutritional status as assessed by Controlling Nutritional Status (CONUT) was associated with mortality in elderly patients with hypertension (37). A study of nutritional status as assessed by the Mini Nutritional Assessment Short-Form (MNA-SF) confirmed that high MNA-SF improves survival in hypertensive patients (38). However, BMI levels may vary significantly between regions and age groups (39). CONUT is assessed by serum cholesterol and may be influenced by medications. In contrast, the MNA-SF assessment may be more complex. Currently, GNRI assessed by serum albumin and BMI has been used extensively for prediction of diseases such as oncology, coronary heart disease, etc. It is simple to calculate and relatively easy to obtain. To our knowledge, no study has separately examined the relationship between GNRI and mortality among elderly patients with hypertension. Our study suggests that GNRI could be a fine predictor of prognosis in elderly patients with hypertension.
In this study, Kaplan-Meier curve analysis showed that both moderate to severe risk and low risk of poor nutrition with GNRI were associated with increased risk of all-cause mortality and cardiovascular mortality in hypertensive patients. To exclude other potential risk factors and comorbidities, we used Cox regression analysis to assess the independent relationship between GNRI and mortality in patients with hypertension. In the fully adjusted model, the hazard ratios for moderate to severe malnutrition risk of GNRI in all-cause mortality and cardiovascular mortality were 2.112(95% CI, 1.377,3.240) and 2.604(95% CI, 1.603,4.229), respectively. These results suggest that the risk of moderate to severe malnutrition in GNRI is an independent predictor of mortality in hypertensive patients. This is consistent with the results on nutritional status and risk of mortality in hypertensive patients in other populations, although they are using different nutritional scores (40–42). Numerous studies have shown that GNRI is reproducible and a more effective predictor of nutritional risk factors and prognosis than BMI and serum albumin alone (14, 43). In addition, the use of computerized GNRI calculation allows for screening of high nutritional risk groups and facilitates long-term, regular, large sample monitoring and follow-up (17).
The results of this observational study are difficult to reveal the specific mechanisms of how malnutrition affects all-cause mortality and cardiovascular mortality in hypertensive patients, but it may suggest the following mechanisms. Low nutritional status is associated with decreased immunity of the organism, which in the elderly population will lead to increased susceptibility to disease, which adds to the disease burden (44). It has been shown that inflammatory factor expression is significantly upregulated in hypertensive patients (45), such as IL-6 and TNF-α, and malnutrition is associated with the activation of inflammatory factors (7). These underlying inflammations may lead to vascular endothelial dysfunction as well as excessive proliferation and migration of vascular smooth muscle cells (46), which in turn aggravate the risk of developing some cardiovascular diseases such as atherosclerosis, coronary heart disease, and heart failure, ultimately leading to cardiovascular events (47). In addition, specific micronutrient deficiencies, such as B vitamins, vitamin D, and dietary fiber may coexist with malnutrition and promote the progression of hypertension (48–50).
The main strengths of this study are as follows: first, this study is a large sample size from a well-established national cohort of the US National Health and Nutrition Examination Survey. Second, we weighted all statistical analyses to obtain reliable results. However, there are still some limitations of this study; first, this study is a retrospective study and there may be unknown confounding factors. Secondly, GNRI was assessed only once in this study, and its change over time during the follow-up period was not assessed. Thirdly, we did not take into account the duration of hypertension.
Conclusion
Calculation of GNRI by using common laboratory indicators provides a practical tool for the first screening of nutritional risk in hypertensive patients, and malnutrition exposure assessed by GNRI can effectively predict the risk of all-cause mortality and cardiovascular mortality in the elderly with hypertension.
Data availability statement
The raw data supporting the conclusions of this article will be made available by the authors, without undue reservation.
Ethics statement
The studies involving human participants were reviewed and approved by National Center for Health Statistics Research Ethics Review Board. The patients/participants provided their written informed consent to participate in this study.
Author contributions
XH and WM contributed to the conception and design, acquisition and drafting of the manuscript or critical revision for important intellectual content. DG, YZ, WL, and WM contributed to interpretation of the data and analysis. HY contributed to the conception and design and reviewing of the manuscript or critical revision for important intellectual content. All authors approved the final version, and agree to be accountable for all aspects of the work. All authors contributed to the article and approved the submitted version.
Acknowledgments
We thank the researchers, staff, and participants of the National Health and Nutrition Examination Survey for their contributions to making this analysis possible.
Conflict of interest
The authors declare that the research was conducted in the absence of any commercial or financial relationships that could be construed as a potential conflict of interest.
Publisher's note
All claims expressed in this article are solely those of the authors and do not necessarily represent those of their affiliated organizations, or those of the publisher, the editors and the reviewers. Any product that may be evaluated in this article, or claim that may be made by its manufacturer, is not guaranteed or endorsed by the publisher.
References
1. Kumar A, Dwivedi SP, Prasad T. Method validation for simultaneous quantification of olmesartan and hydrochlorothiazide in human plasma using LC-MS/MS and its application through bioequivalence study in healthy volunteers. Front Pharmacol. (2019) 10:810. doi: 10.3389/fphar.2019.00810
2. Kim CS, Han KD, Choi HS, Bae EH, Ma SK, Kim SW. Association of hypertension and blood pressure with kidney cancer risk: a nationwide population-based cohort study. Hypertension. (2020) 75(6):1439–46. doi: 10.1161/HYPERTENSIONAHA.120.14820
3. Tao L, Gu X, Xu E, Ren S, Zhang L, Liu W, et al. Osthole protects against Ang II-induced endotheliocyte death by targeting NF-κB pathway and Keap-1/Nrf2 pathway. Am J Transl Res. (2019) 11(1):142–59.30787975
4. Dikalova AE, Pandey A, Xiao L, Arslanbaeva L, Sidorova T, Lopez MG, et al. Mitochondrial deacetylase Sirt3 reduces vascular dysfunction and hypertension while Sirt3 depletion in essential hypertension is linked to vascular inflammation and oxidative stress. Circ Res. (2020) 126(4):439–52. doi: 10.1161/CIRCRESAHA.119.315767
5. Shetty PB, Tang H, Tayo BO, Morrison AC, Hanis CL, Rao DC, et al. Variants in CXADR and F2RL1 are associated with blood pressure and obesity in African-Americans in regions identified through admixture mapping. J Hypertens. (2012) 30(10):1970–6. doi: 10.1097/HJH.0b013e3283578c80
6. Nagahata T, Nakamura M, Ojima T, Kondo I, Ninomiya T, Yoshita K, et al. Relationships among food group intakes, household expenditure, and education attainment in a general Japanese population: nIPPON DATA2010. J Epidemiol. (2018) 28(Suppl 3):S23–s8. doi: 10.2188/jea.JE20170248
7. Nelson JJ, Liao D, Sharrett AR, Folsom AR, Chambless LE, Shahar E, et al. Serum albumin level as a predictor of incident coronary heart disease: the atherosclerosis risk in communities (ARIC) study. Am J Epidemiol. (2000) 151(5):468–77. doi: 10.1093/oxfordjournals.aje.a010232
8. Lew CCH, Yandell R, Fraser RJL, Chua AP, Chong MFF, Miller M. Association between malnutrition and clinical outcomes in the intensive care unit: a systematic review [formula: see text]. JPEN J Parenter Enteral Nutr. (2017) 41(5):744–58. doi: 10.1177/0148607115625638
9. Gümüşsoy M, Atmış V, Yalçın A, Bahşi R, Yişit S, Arı S, et al. Malnutrition-sarcopenia syndrome and all-cause mortality in hospitalized older people. Clin Nutr. (2021) 40(11):5475–81. doi: 10.1016/j.clnu.2021.09.036
10. Djoumessi YF. The impact of malnutrition on infant mortality and life expectancy in Africa. Nutrition. (2022):103–4. 111760. doi: 10.1016/j.nut.2022.111760
11. Sze S, Pellicori P, Zhang J, Clark AL. Malnutrition, congestion and mortality in ambulatory patients with heart failure. Heart. (2019) 105(4):297–306. doi: 10.1136/heartjnl-2018-313312
12. Zhou Q, Liu X, Zhao Y, Qin P, Ren Y, Liu D, et al. BMI And risk of all-cause mortality in normotensive and hypertensive adults: the rural Chinese cohort study. Public Health Nutr. (2021) 24(17):5805–14. doi: 10.1017/S1368980021001592
13. Cai X, Hu J, Wen W, Wang M, Zhu Q, Liu S, et al. Association between the geriatric nutritional risk index and the risk of stroke in elderly patients with hypertension: a longitudinal and cohort study. Front Nutr. (2022) 9:1048206. doi: 10.3389/fnut.2022.1048206
14. Bouillanne O, Morineau G, Dupont C, Coulombel I, Vincent JP, Nicolis I, et al. Geriatric nutritional risk Index: a new index for evaluating at-risk elderly medical patients. Am J Clin Nutr. (2005) 82(4):777–83. doi: 10.1093/ajcn/82.4.777
15. Dong CH, Chen SY, Zeng HL, Yang B, Pan J. Geriatric nutritional risk index predicts all-cause mortality in patients with heart failure: a systematic review and meta-analysis. Clinics (Sao Paulo) (2021) 76:e2258. doi: 10.6061/clinics/2021/e2258
16. Xiong J, Wang M, Wang J, Yang K, Shi Y, Zhang J, et al. Geriatric nutrition risk index is associated with renal progression, cardiovascular events and all-cause mortality in chronic kidney disease. J Nephrol. (2020) 33(4):783–93. doi: 10.1007/s40620-019-00676-1
17. Shen X, Yang L, Gu X, Liu YY, Jiang L. Geriatric nutrition risk index as a predictor of cardiovascular and all-cause mortality in older Americans with diabetes. Diabetol Metab Syndr. (2023) 15(1):89. doi: 10.1186/s13098-023-01060-7
18. Abd Aziz NAS, Teng N, Abdul Hamid MR, Ismail NH. Assessing the nutritional status of hospitalized elderly. Clin Interv Aging. (2017) 12:1615–25. doi: 10.2147/CIA.S140859
19. Johnson CL, Paulose-Ram R, Ogden CL, Carroll MD, Kruszon-Moran D, Dohrmann SM, et al. National health and nutrition examination survey: analytic guidelines, 1999-2010. Vital Health Stat 2. (2013) (161):1–24.
20. Oparil S, Acelajado MC, Bakris GL, Berlowitz DR, Cífková R, Dominiczak AF, et al. Hypertension. Nat Rev Dis Primers. (2018) 4:18014. doi: 10.1038/nrdp.2018.14
21. Shachar SS, Deal AM, Weinberg M, Nyrop KA, Williams GR, Nishijima TF, et al. Skeletal muscle measures as predictors of toxicity, hospitalization, and survival in patients with metastatic breast cancer receiving taxane-based chemotherapy. Clin Cancer Res. (2017) 23(3):658–65. doi: 10.1158/1078-0432.CCR-16-0940
22. Shen X, Gu X, Liu YY, Yang L, Zheng M, Jiang L. Association between dietary calcium and depression among American adults: national health and nutrition examination survey. Front Nutr. (2023) 10:1042522. doi: 10.3389/fnut.2023.1042522
23. Rattan P, Penrice DD, Ahn JC, Ferrer A, Patnaik M, Shah VH, et al. Inverse association of telomere length with liver disease and mortality in the US population. Hepatol Commun. (2022) 6(2):399–410. doi: 10.1002/hep4.1803
24. Fan H, Xu C, Li W, Huang Y, Hua R, Xiong Y, et al. Ideal cardiovascular health metrics are associated with reduced severity of hepatic steatosis and liver fibrosis detected by transient elastography. Nutrients. (2022) 14(24). doi: 10.3390/nu14245344
25. Levey AS, Stevens LA, Schmid CH, Zhang YL, Castro AF 3rd, Feldman HI, et al. A new equation to estimate glomerular filtration rate. Ann Intern Med. (2009) 150(9):604–12. doi: 10.7326/0003-4819-150-9-200905050-00006
26. Nayor M, Larson MG, Wang N, Santhanakrishnan R, Lee DS, Tsao CW, et al. The association of chronic kidney disease and microalbuminuria with heart failure with preserved vs. Reduced ejection fraction. Eur J Heart Fail. (2017) 19(5):615–23. doi: 10.1002/ejhf.778
27. Flack JM, Adekola B. Blood pressure and the new ACC/AHA hypertension guidelines. Trends Cardiovasc Med. (2020) 30(3):160–4. doi: 10.1016/j.tcm.2019.05.003
28. Johnson CL, Dohrmann SM, Burt VL, Mohadjer LK. National Health and Nutrition Examination Survey: sample design, 2011-2014. Vital Health Stat 2 (2014) (162):1–33.
29. Bottomley JM, Raymond FD. Pharmaco-economic issues for diabetes therapy. Best Pract Res Clin Endocrinol Metab. (2007) 21(4):657–85. doi: 10.1016/j.beem.2007.08.002
30. Huang W, Xiao Y, Wang H, Li K. Association of geriatric nutritional risk index with the risk of osteoporosis in the elderly population in the NHANES. Front Endocrinol (Lausanne). (2022) 13:965487. doi: 10.3389/fendo.2022.965487
31. Lee M, Lim JS, Kim Y, Lee JH, Kim CH, Lee SH, et al. Association between geriatric nutritional risk Index and post-stroke cognitive outcomes. Nutrients. (2021) 13(6). doi: 10.3390/nu13061776
32. Morgan DJ, Dhruva SS, Coon ER, Wright SM, Korenstein D. 2017 Update on medical overuse: a systematic review. JAMA Intern Med. (2018) 178(1):110–5. doi: 10.1001/jamainternmed.2017.4361
33. Barker DJ, Gelow J, Thornburg K, Osmond C, Kajantie E, Eriksson JG. The early origins of chronic heart failure: impaired placental growth and initiation of insulin resistance in childhood. Eur J Heart Fail. (2010) 12(8):819–25. doi: 10.1093/eurjhf/hfq069
34. Xu W, Shubina M, Goldberg SI, Turchin A. Body mass index and all-cause mortality in patients with hypertension. Obesity (Silver Spring). (2015) 23(8):1712–20. doi: 10.1002/oby.21129
35. Wells JC, Sawaya AL, Wibaek R, Mwangome M, Poullas MS, Yajnik CS, et al. The double burden of malnutrition: aetiological pathways and consequences for health. Lancet. (2020) 395(10217):75–88. doi: 10.1016/S0140-6736(19)32472-9
36. Barazzoni R, Gortan Cappellari G. Double burden of malnutrition in persons with obesity. Rev Endocr Metab Disord. (2020) 21(3):307–13. doi: 10.1007/s11154-020-09578-1
37. Sun X, Luo L, Zhao X, Ye P. Controlling nutritional status (CONUT) score as a predictor of all-cause mortality in elderly hypertensive patients: a prospective follow-up study. BMJ Open. (2017) 7(9):e015649. doi: 10.1136/bmjopen-2016-015649
38. Kańtoch A, Wójkowska-Mach J, Wizner B, Heczko P, Grodzicki T, Gryglewska B. What factors influence the long-term survival of nursing home residents with severe disabilities? Folia Med Cracov. (2021) 61(1):67–79.
39. Nevill AM, Metsios GS. The need to redefine age- and gender-specific overweight and obese body mass index cutoff points. Nutr Diabetes. (2015) 5(11):e186. doi: 10.1038/nutd.2015.36
40. Miličević T, Kolčić I, Đogaš T, Živković PM, Radman M, Radić J, et al. Nutritional Status and indicators of 2-year mortality and Re-hospitalizations: experience from the internal clinic departments in tertiary hospital in Croatia. Nutrients (2020) 13(1). doi: 10.3390/nu13010068
41. Kalantar-Zadeh K, Kopple JD, Block G, Humphreys MH. A malnutrition-inflammation score is correlated with morbidity and mortality in maintenance hemodialysis patients. Am J Kidney Dis. (2001) 38(6):1251–63. doi: 10.1053/ajkd.2001.29222
42. Chien SC, Chandramouli C, Lo CI, Lin CF, Sung KT, Huang WH, et al. Associations of obesity and malnutrition with cardiac remodeling and cardiovascular outcomes in Asian adults: a cohort study. PLoS Med. (2021) 18(6):e1003661. doi: 10.1371/journal.pmed.1003661
43. Takahashi H, Ito Y, Ishii H, Aoyama T, Kamoi D, Kasuga H, et al. Geriatric nutritional risk index accurately predicts cardiovascular mortality in incident hemodialysis patients. J Cardiol. (2014) 64(1):32–6. doi: 10.1016/j.jjcc.2013.10.018
44. Barbeito-Andrés J, Pezzuto P, Higa LM, Dias AA, Vasconcelos JM, Santos TMP, et al. Congenital Zika syndrome is associated with maternal protein malnutrition. Sci Adv. (2020) 6(2):eaaw6284. doi: 10.1126/sciadv.aaw6284
45. Liu J, Liu J, Shi L, Zhang F, Yu L, Yang X, et al. Preliminary study of microRNA-126 as a novel therapeutic target for primary hypertension. Int J Mol Med. (2018) 41(4):1835–44. doi: 10.3892/ijmm.2018.3420
46. Hunt KJ, Jaffa MA, Garrett SM, Luttrell DK, Lipson KE, Lopes-Virella MF, et al. Plasma connective tissue growth factor (CTGF/CCN2) levels predict myocardial infarction in the veterans affairs diabetes trial (VADT) cohort. Diabetes Care. (2018) 41(4):840–6. doi: 10.2337/dc17-2083
47. Jeong K, Kim JH, Murphy JM, Park H, Kim SJ, Rodriguez YAR, et al. Nuclear focal adhesion kinase controls vascular smooth muscle cell proliferation and neointimal hyperplasia through GATA4-mediated cyclin D1 transcription. Circ Res. (2019) 125(2):152–66. doi: 10.1161/CIRCRESAHA.118.314344
48. Wolffenbuttel BHR, Heiner-Fokkema MR, Green R, Gans ROB. Relationship between serum B12 concentrations and mortality: experience in NHANES. BMC Med. (2020) 18(1):307. doi: 10.1186/s12916-020-01771-y
49. de la Guía-Galipienso F, Martínez-Ferran M, Vallecillo N, Lavie CJ, Sanchis-Gomar F, Pareja-Galeano H. Vitamin D and cardiovascular health. Clin Nutr. (2021) 40(5):2946–57. doi: 10.1016/j.clnu.2020.12.025
Keywords: Geriatric nutritional risk index, hypertension, NHANES, observational study, mortality
Citation: Huo X, Wu M, Gao D, Zhou Y, Han X, Lai W, Wang M and Hang Y (2023) Geriatric nutrition risk index in the prediction of all-cause and cardiovascular mortality in elderly hypertensive population: NHANES 1999–2016. Front. Cardiovasc. Med. 10:1203130. doi: 10.3389/fcvm.2023.1203130
Received: 10 April 2023; Accepted: 19 June 2023;
Published: 3 July 2023.
Edited by:
Maria Marketou, University Hospital of Heraklion, GreeceReviewed by:
Jianqiao Chen, People’s Hospital of Zhengzhou University, People’s Hospital of Henan University, ChinaYi-Fei Dong, Second Affiliated Hospital of Nanchang University, China
© 2023 Huo, Wu, Gao, Zhou, Han, Lai, Wang and Hang. This is an open-access article distributed under the terms of the Creative Commons Attribution License (CC BY). The use, distribution or reproduction in other forums is permitted, provided the original author(s) and the copyright owner(s) are credited and that the original publication in this journal is cited, in accordance with accepted academic practice. No use, distribution or reproduction is permitted which does not comply with these terms.
*Correspondence: Yilun Hang hangyilun1995@163.com